

Your traffic. Your index. Your rules.
Loghound watches every visit from both ends at once — your web server’s access logs and a one-line beacon in the visitor’s browser — and keeps everything it learns in two private Opensolr indexes on your own account. They are yours: connect them to any dashboard or tool you like, or take the MIT-licensed code and wire it to another backend.
Free and open source, MIT licensed. It runs on your server and reads your logs read-only. The indexes live on your Opensolr account — an account is required, and the free plan is enough to start. No telemetry, and no vendor copy of your traffic.
- 01
Two sources, read together
The access log says what your server saw; the beacon says what the browser did. A bot has to fool both at once, and that is where it slips.
- 02
Cross-checked on your own server
It runs next to your web server, reads the logs without ever writing to them, and gives every visit a verdict with its reasons.
- 03
Stored in your private indexes
Every request and every visit lands in Opensolr indexes on your own account, behind your own credentials. Nobody else holds a copy.
- 04
Read from anything you like
The Loghound panel is one reader. Your own dashboard, a script or any Solr client can read the same indexes, and the MIT code can be rewired.
Yours, end to end
The code is MIT and runs on your server. The data sits in private indexes on your own Opensolr account: point any dashboard, script or Solr client at them, or rewire the code to a backend of your own. Nothing locks you in.
Bot and attack detection like no other
Headless Chrome on rotating residential proxies collapses into one fingerprint across dozens of unrelated addresses. Attack probes are flagged with what your server answered. Every verdict carries its reasons.
Numbers that tell the truth
Real time on site on three separate clocks, not a tab left open for an hour. SEO Tools comparing any two periods, and a view per website.
In seven languages
English, Română, Français, Deutsch, Español, 中文 and 日本語 — the panel, the installer and the sign-in page. Reword any sentence, or add a language, on your own installation. How.
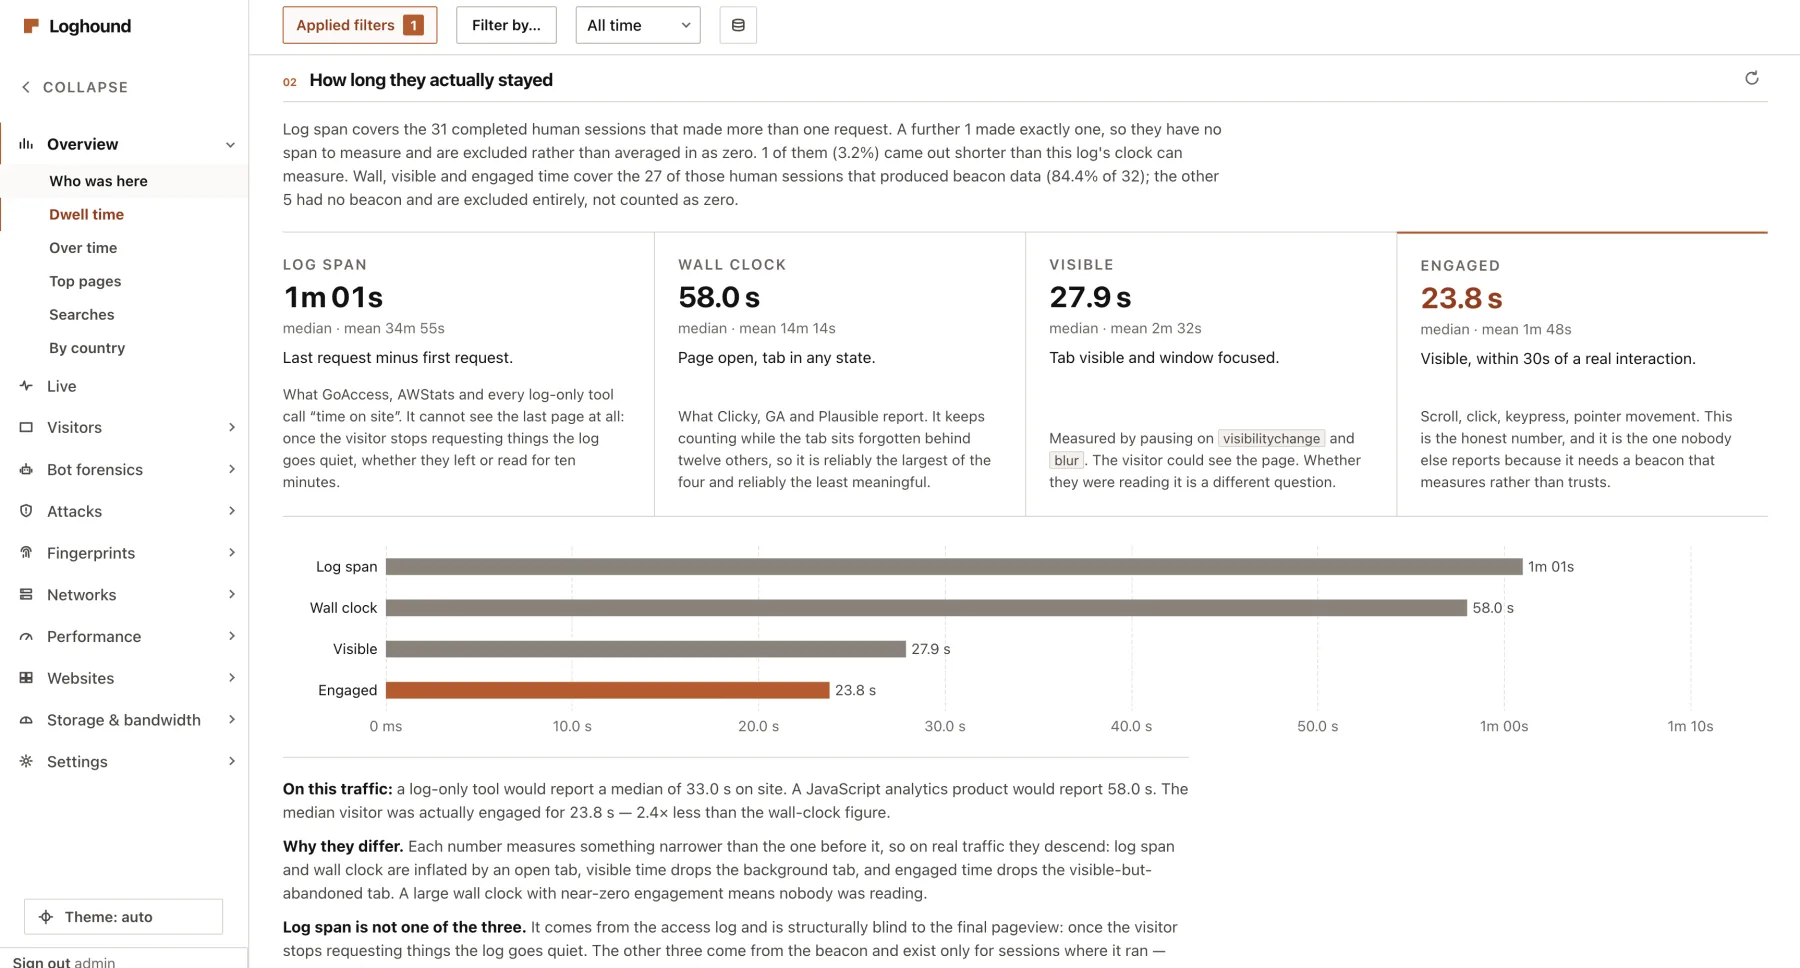
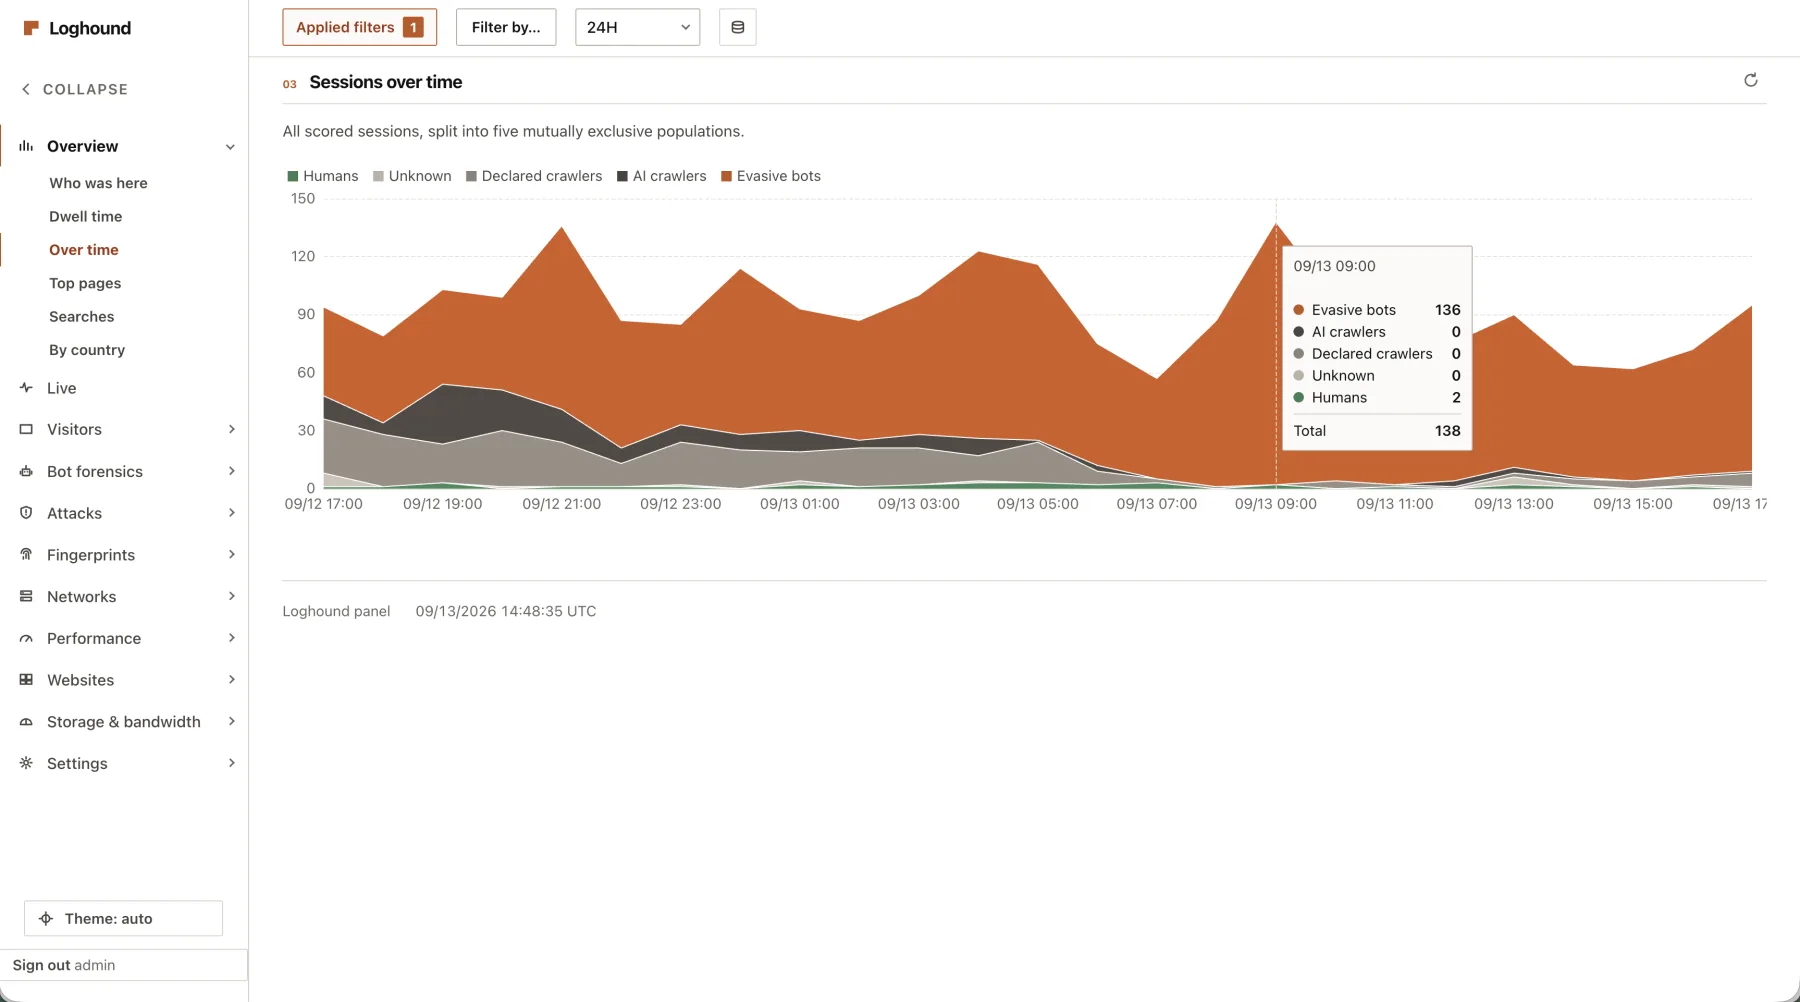
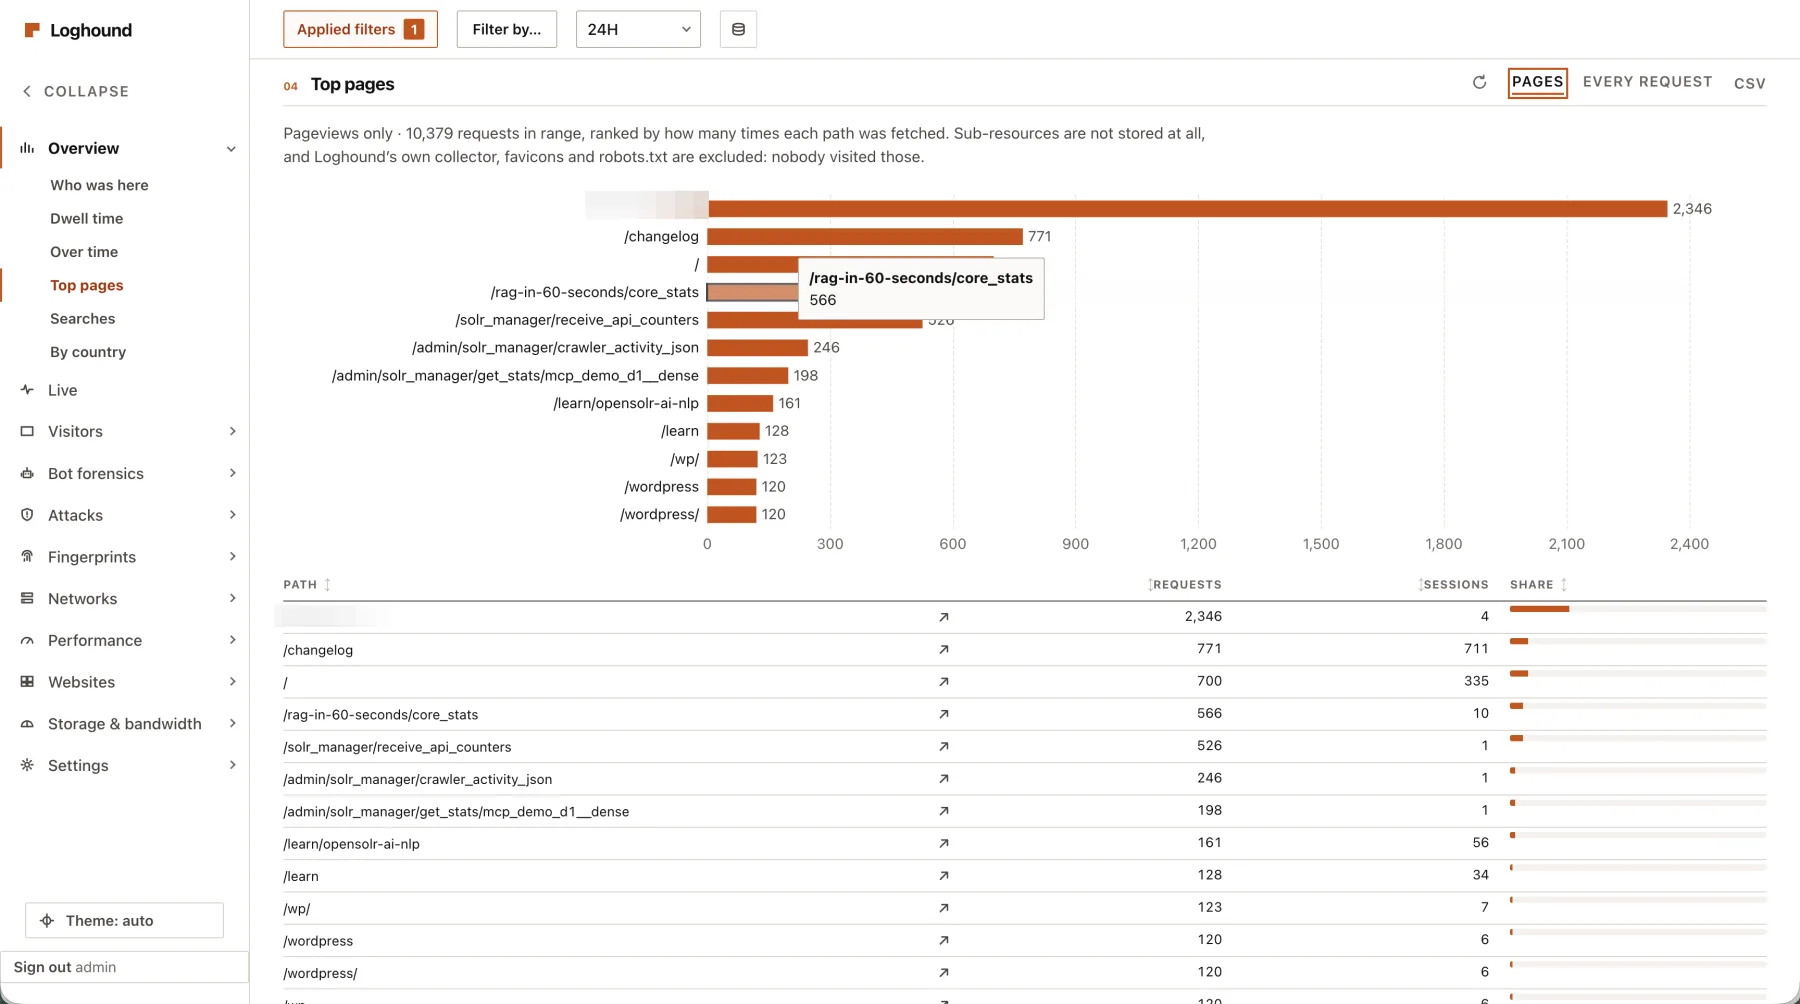
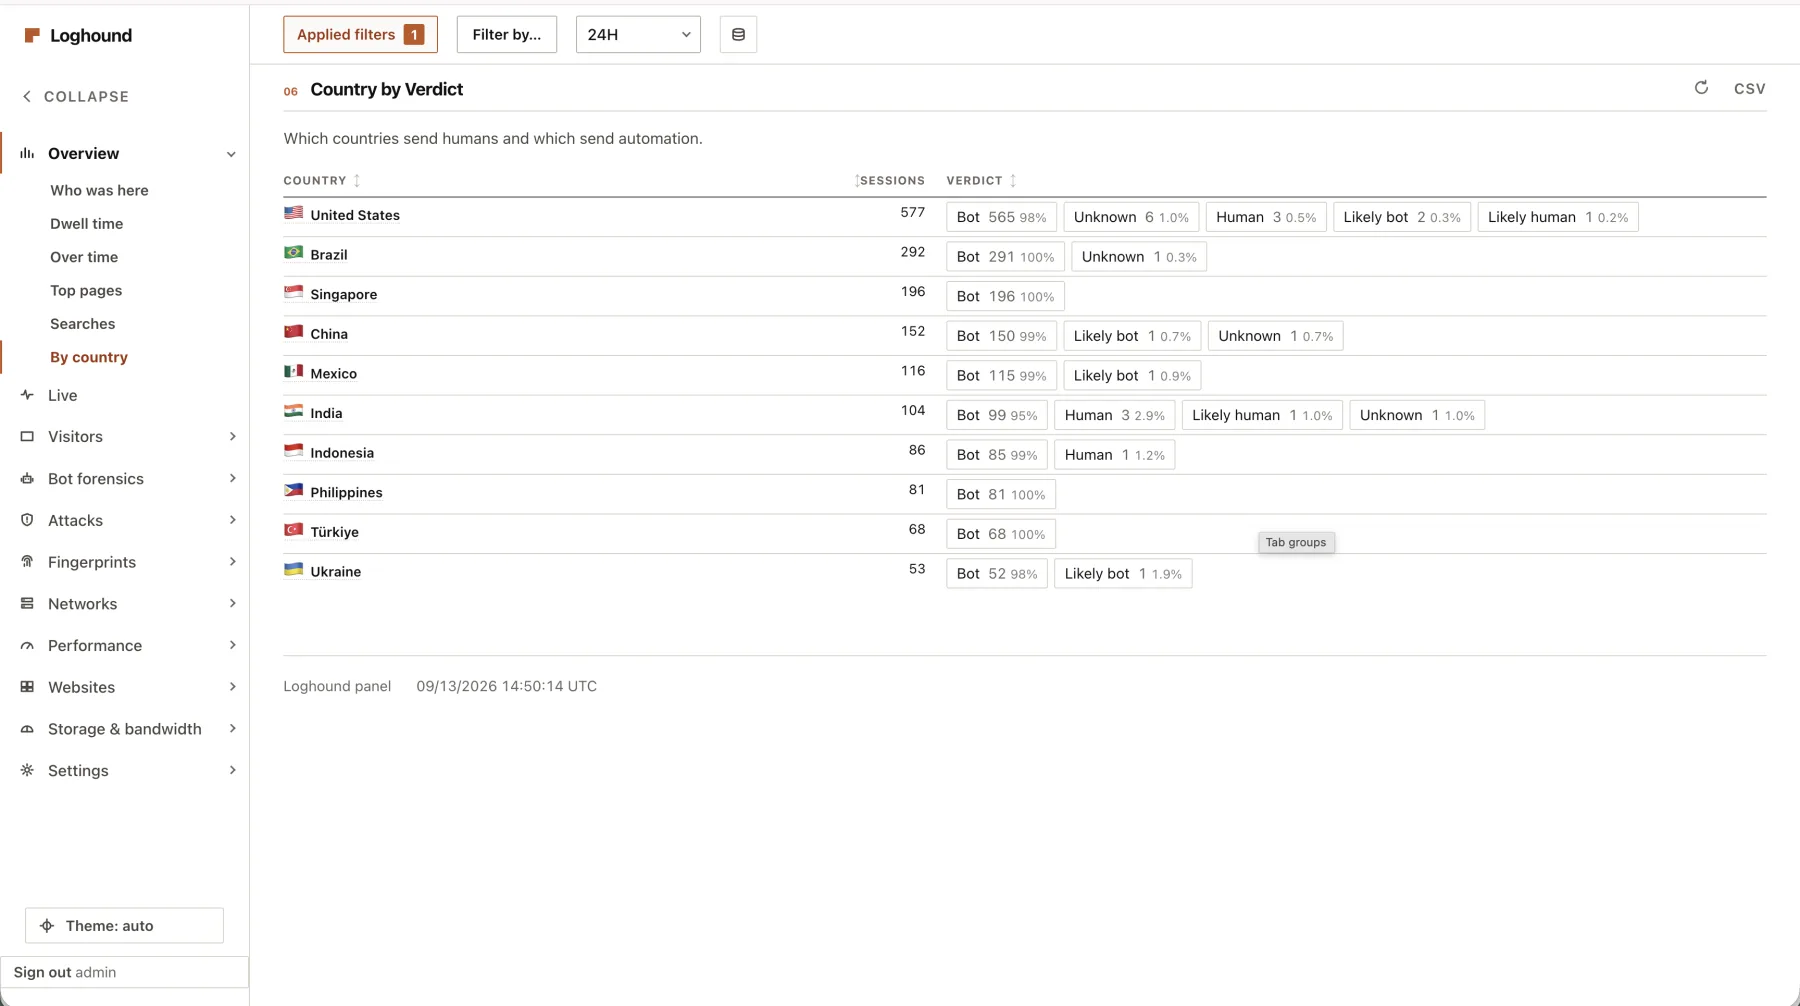
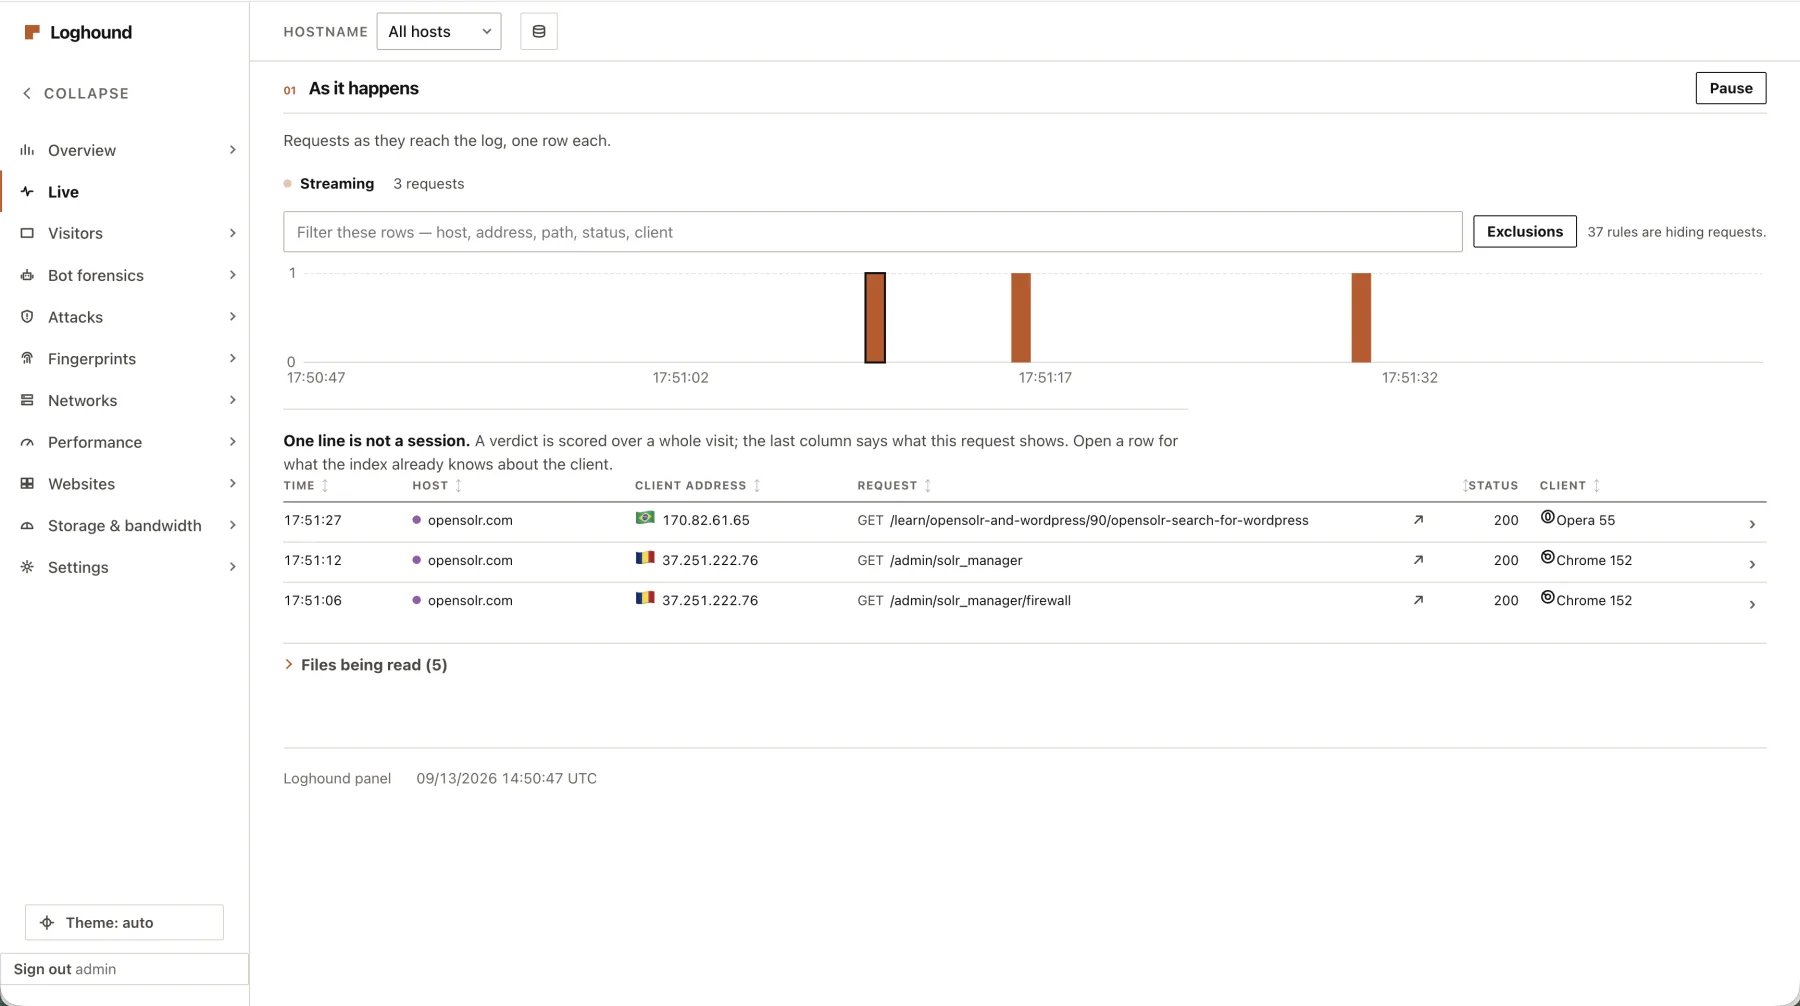
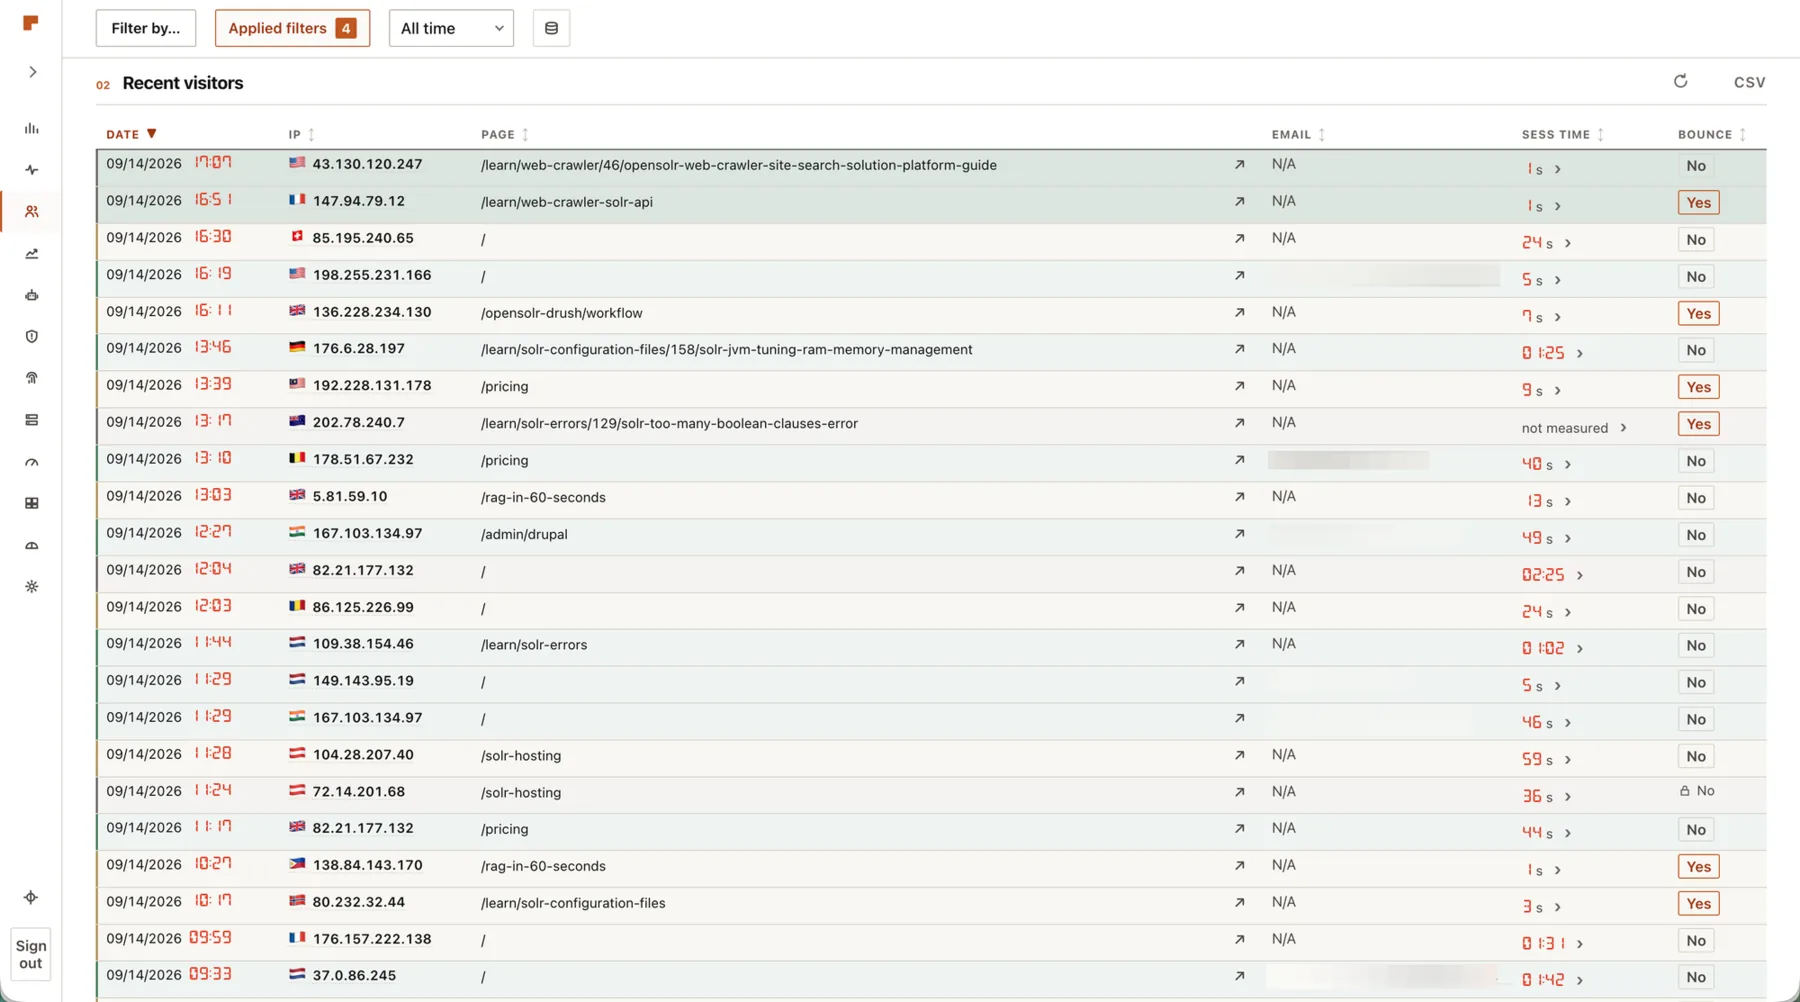
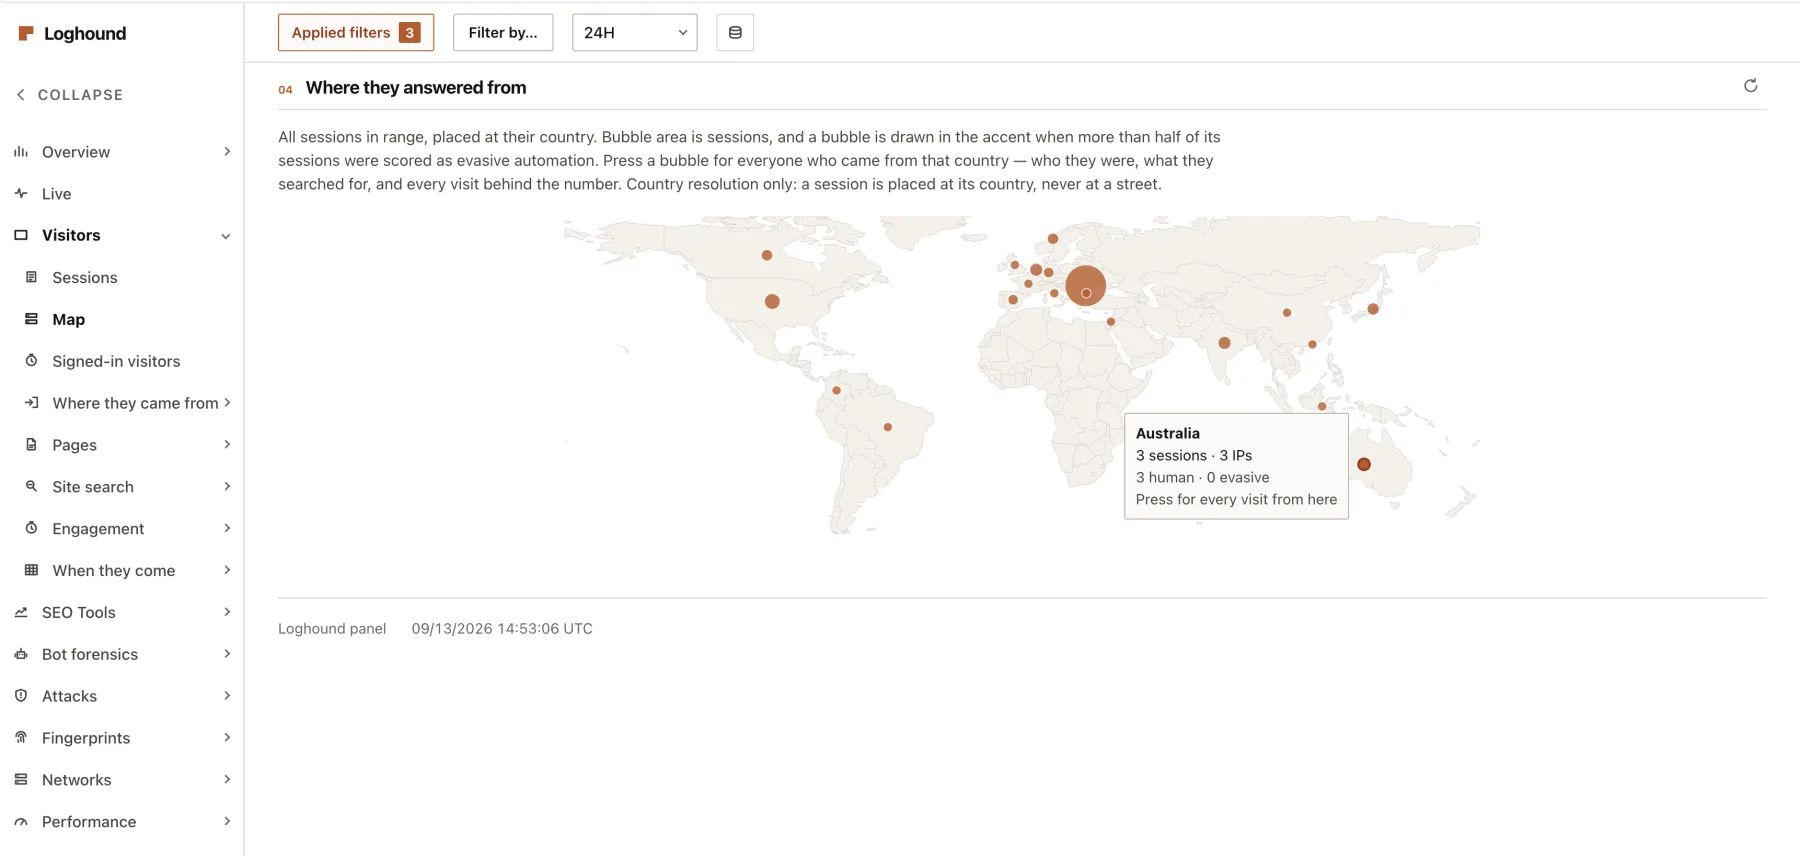
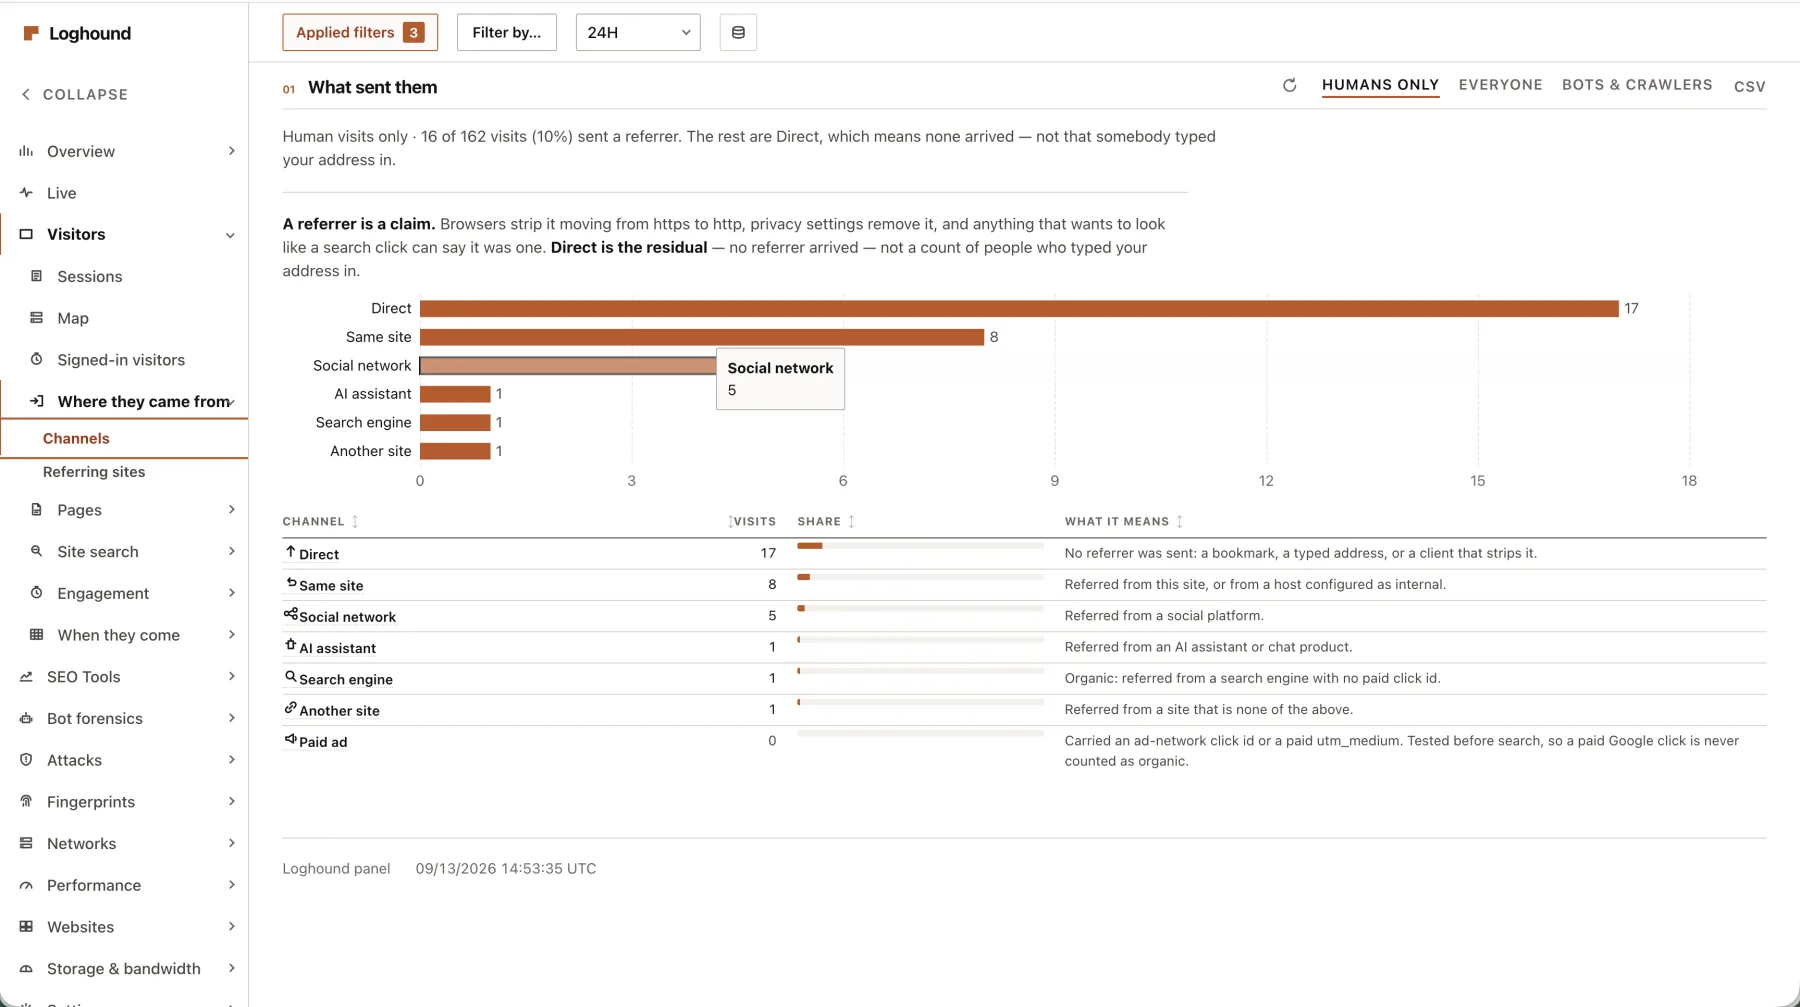
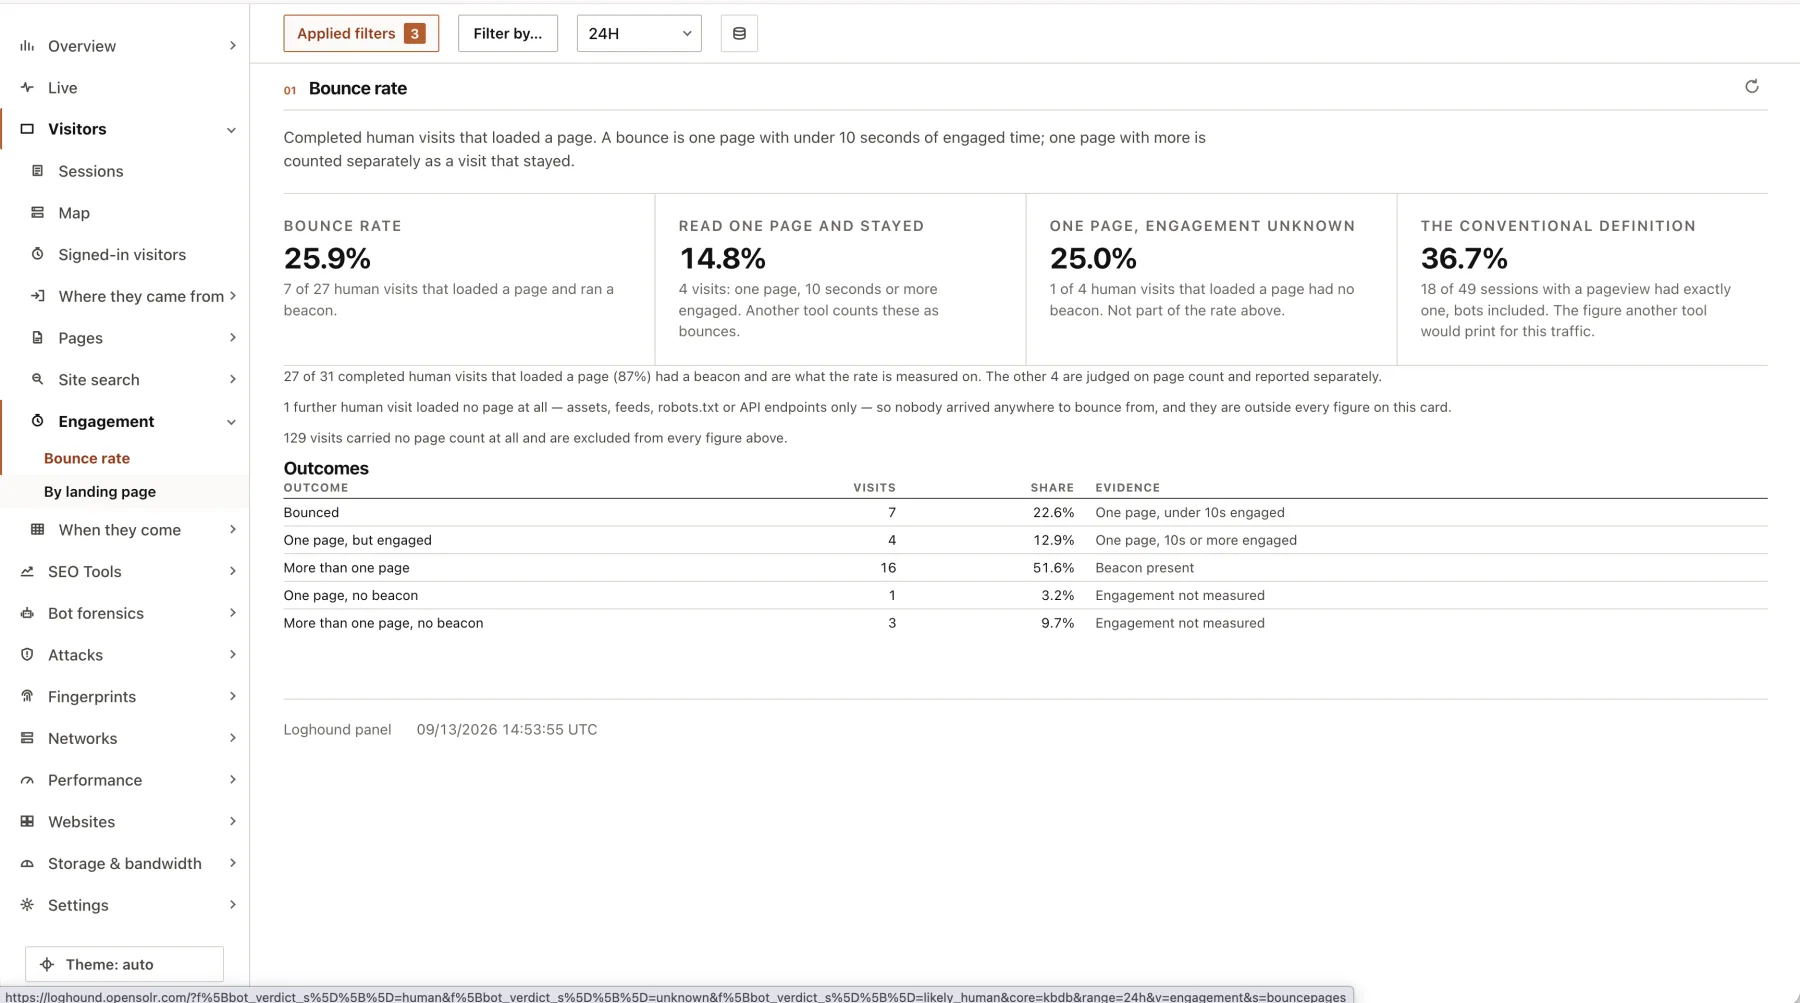
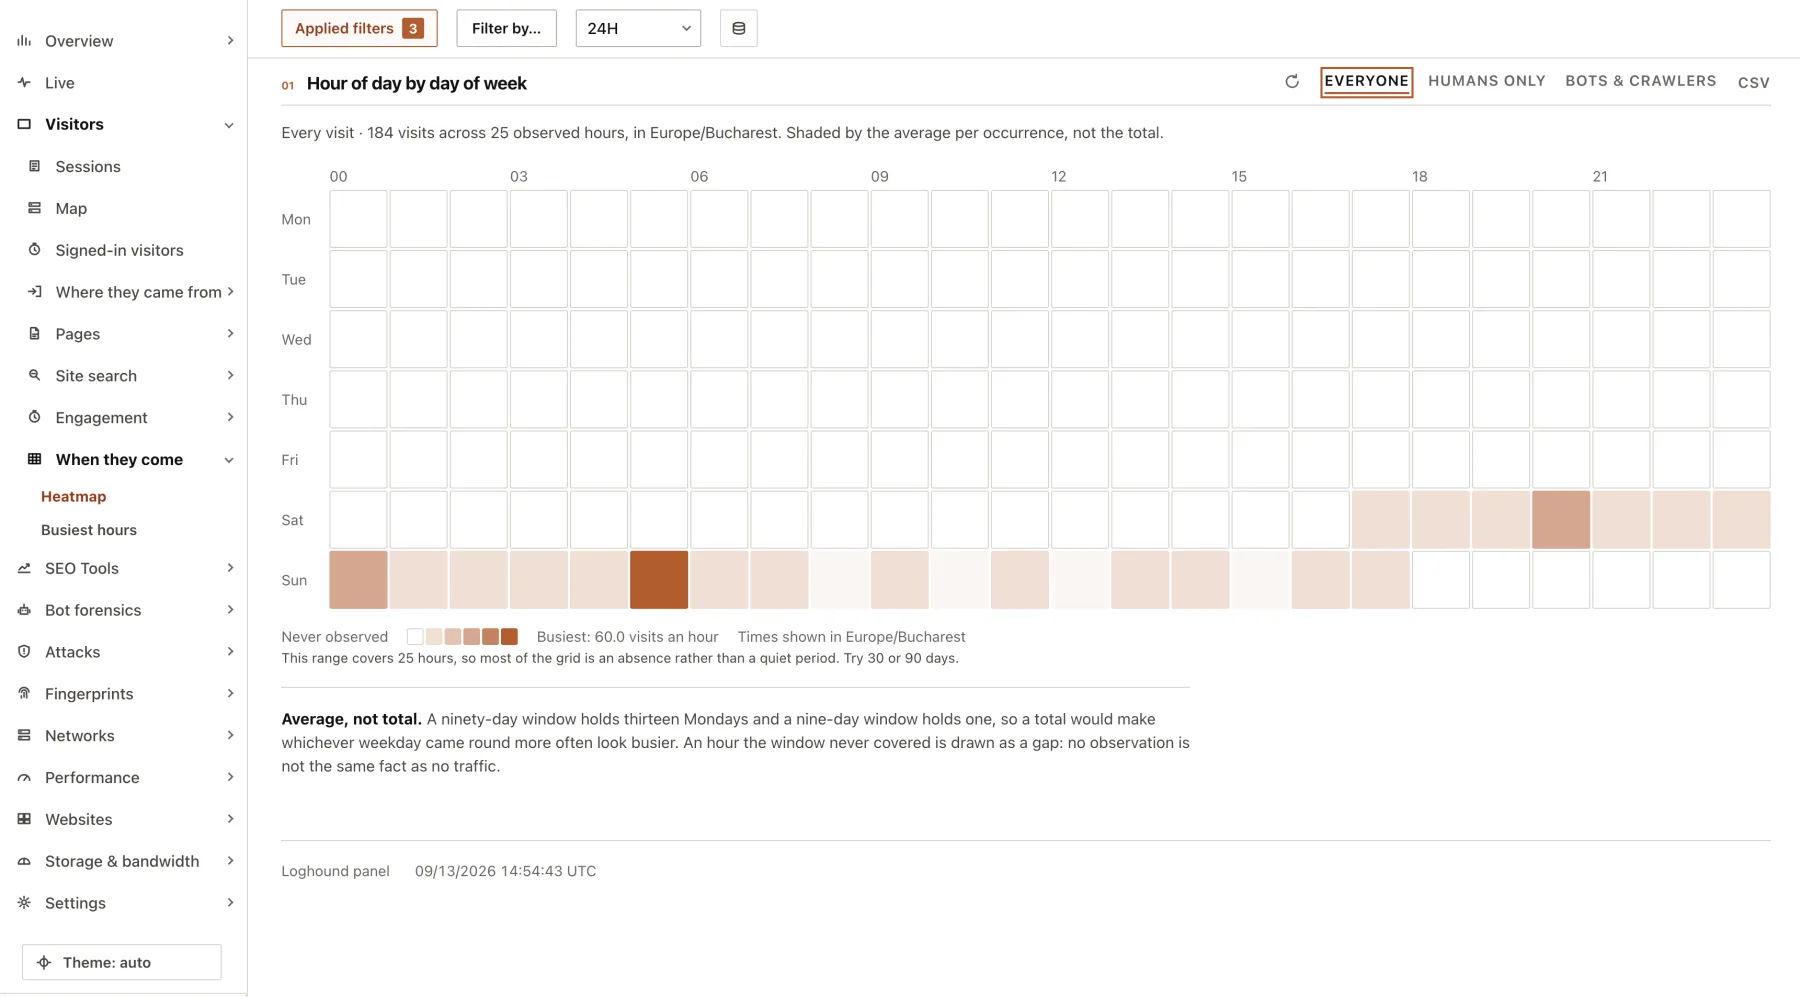
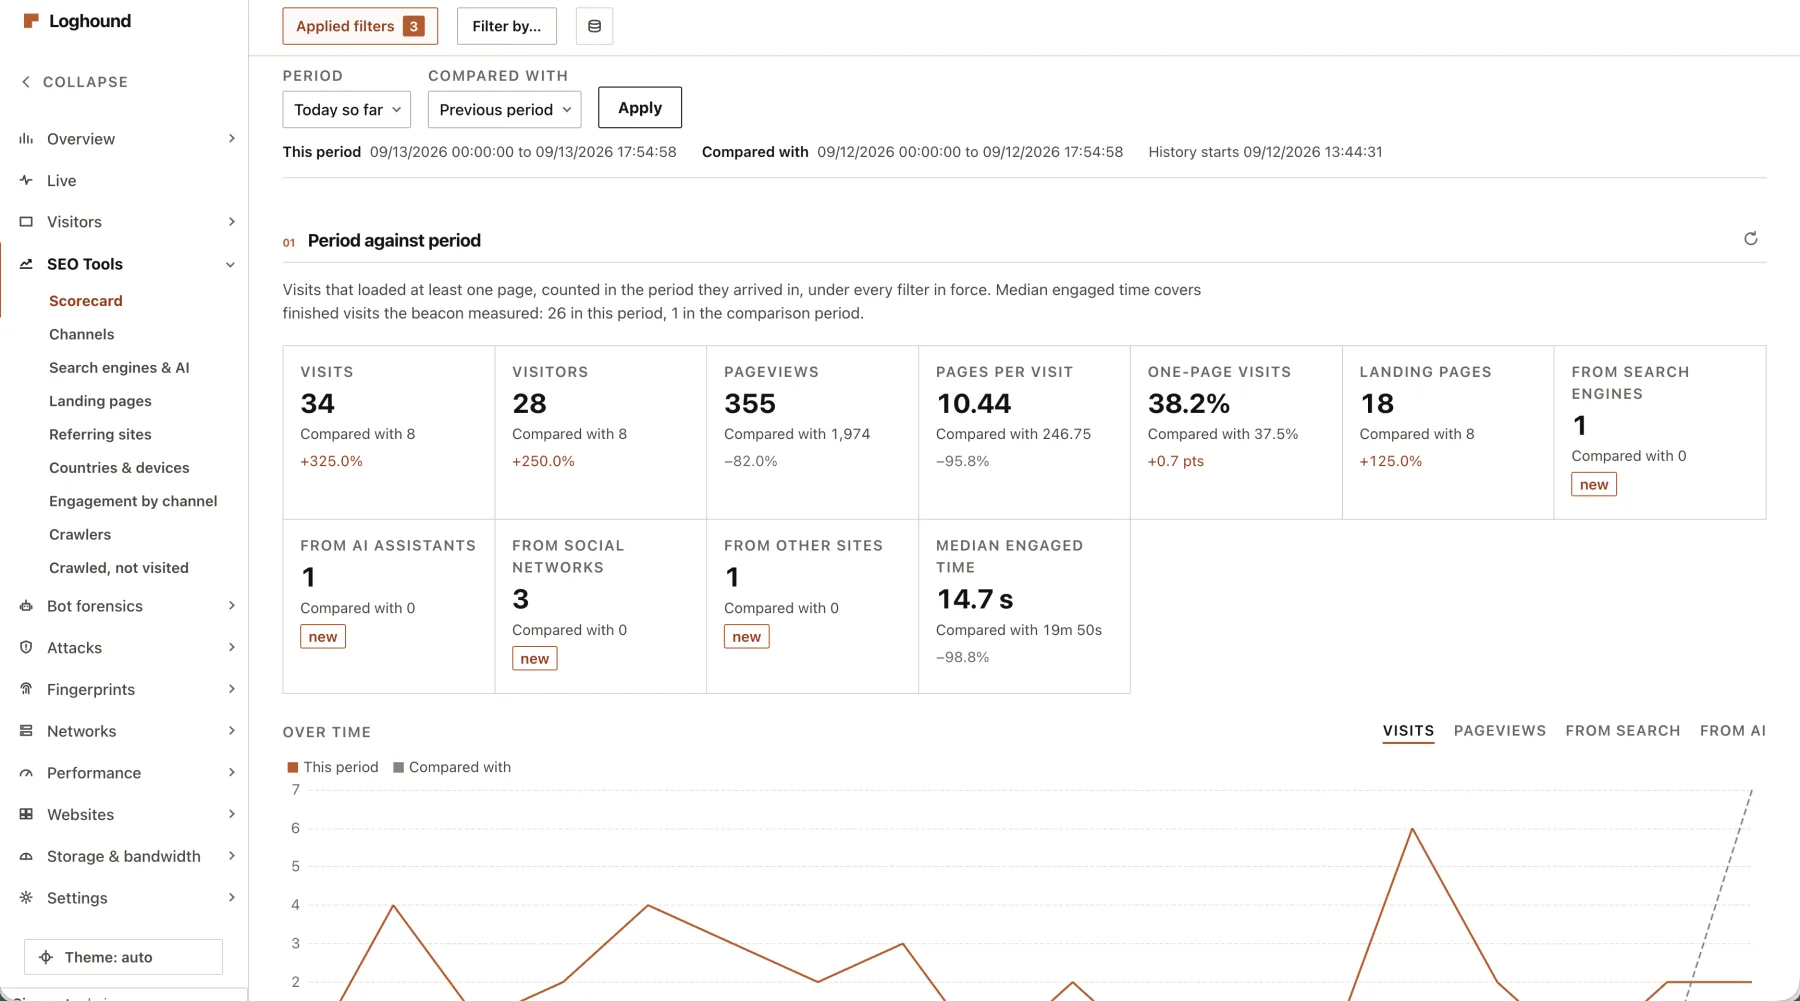
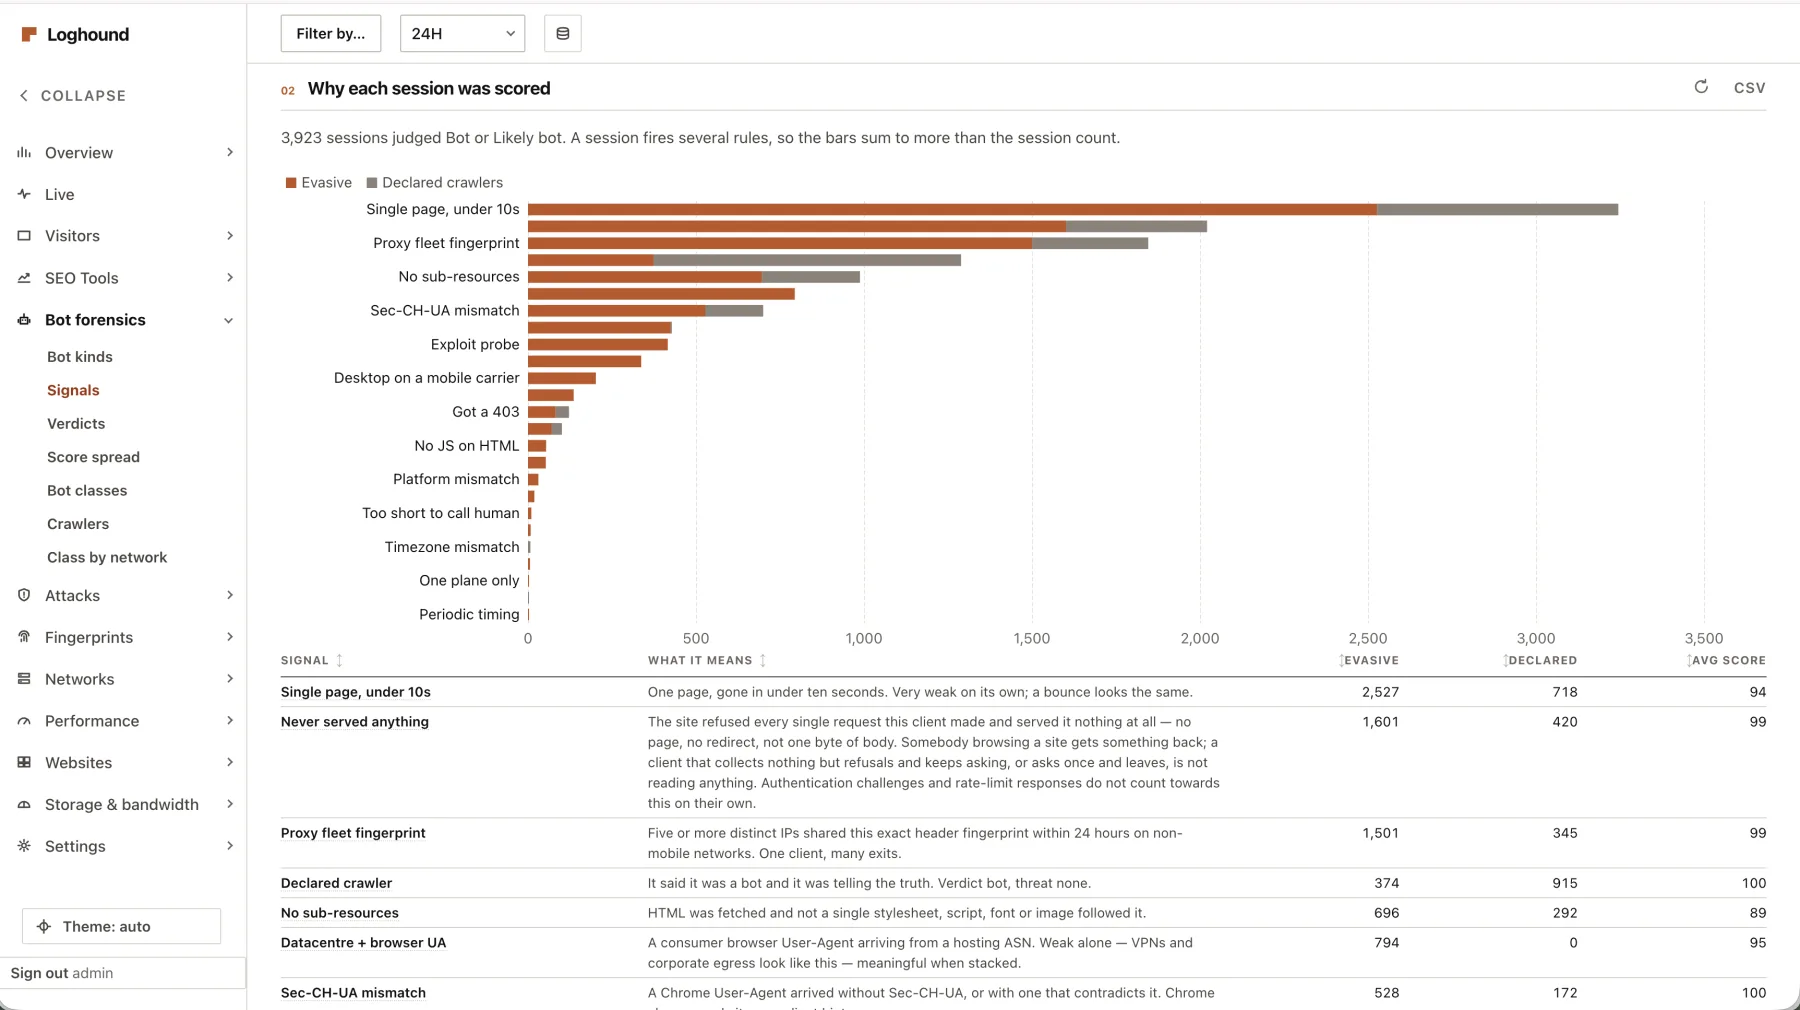
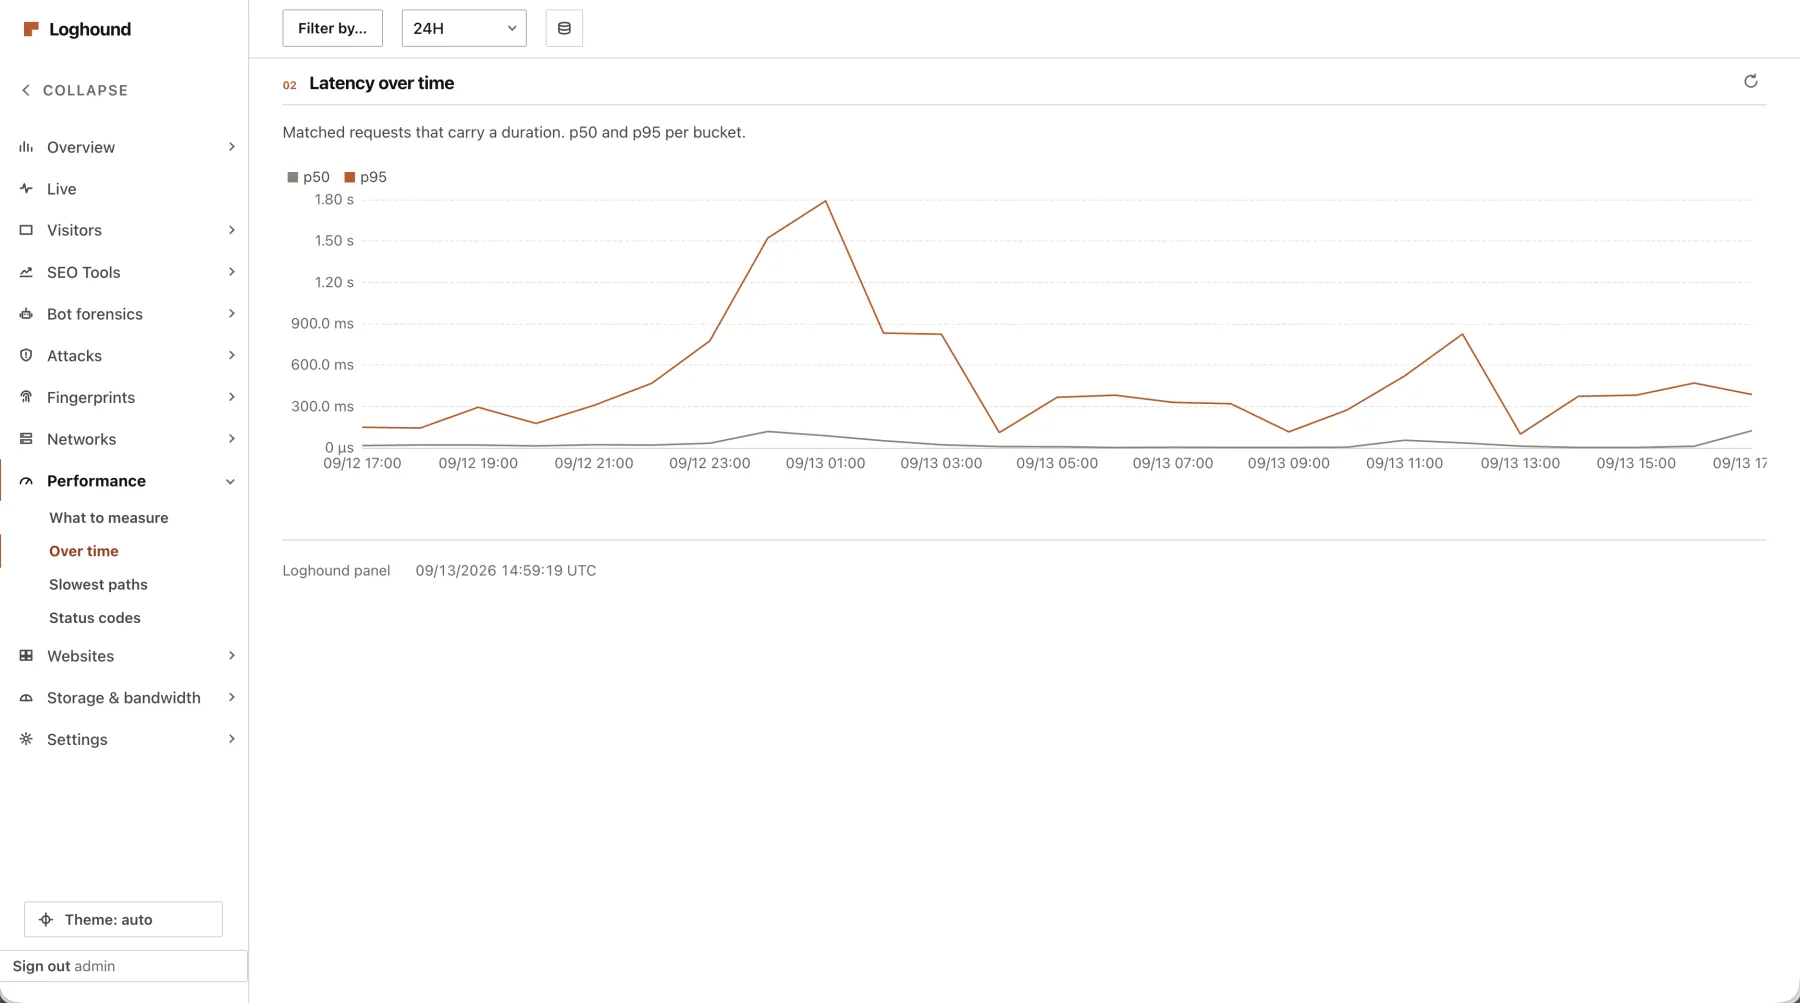
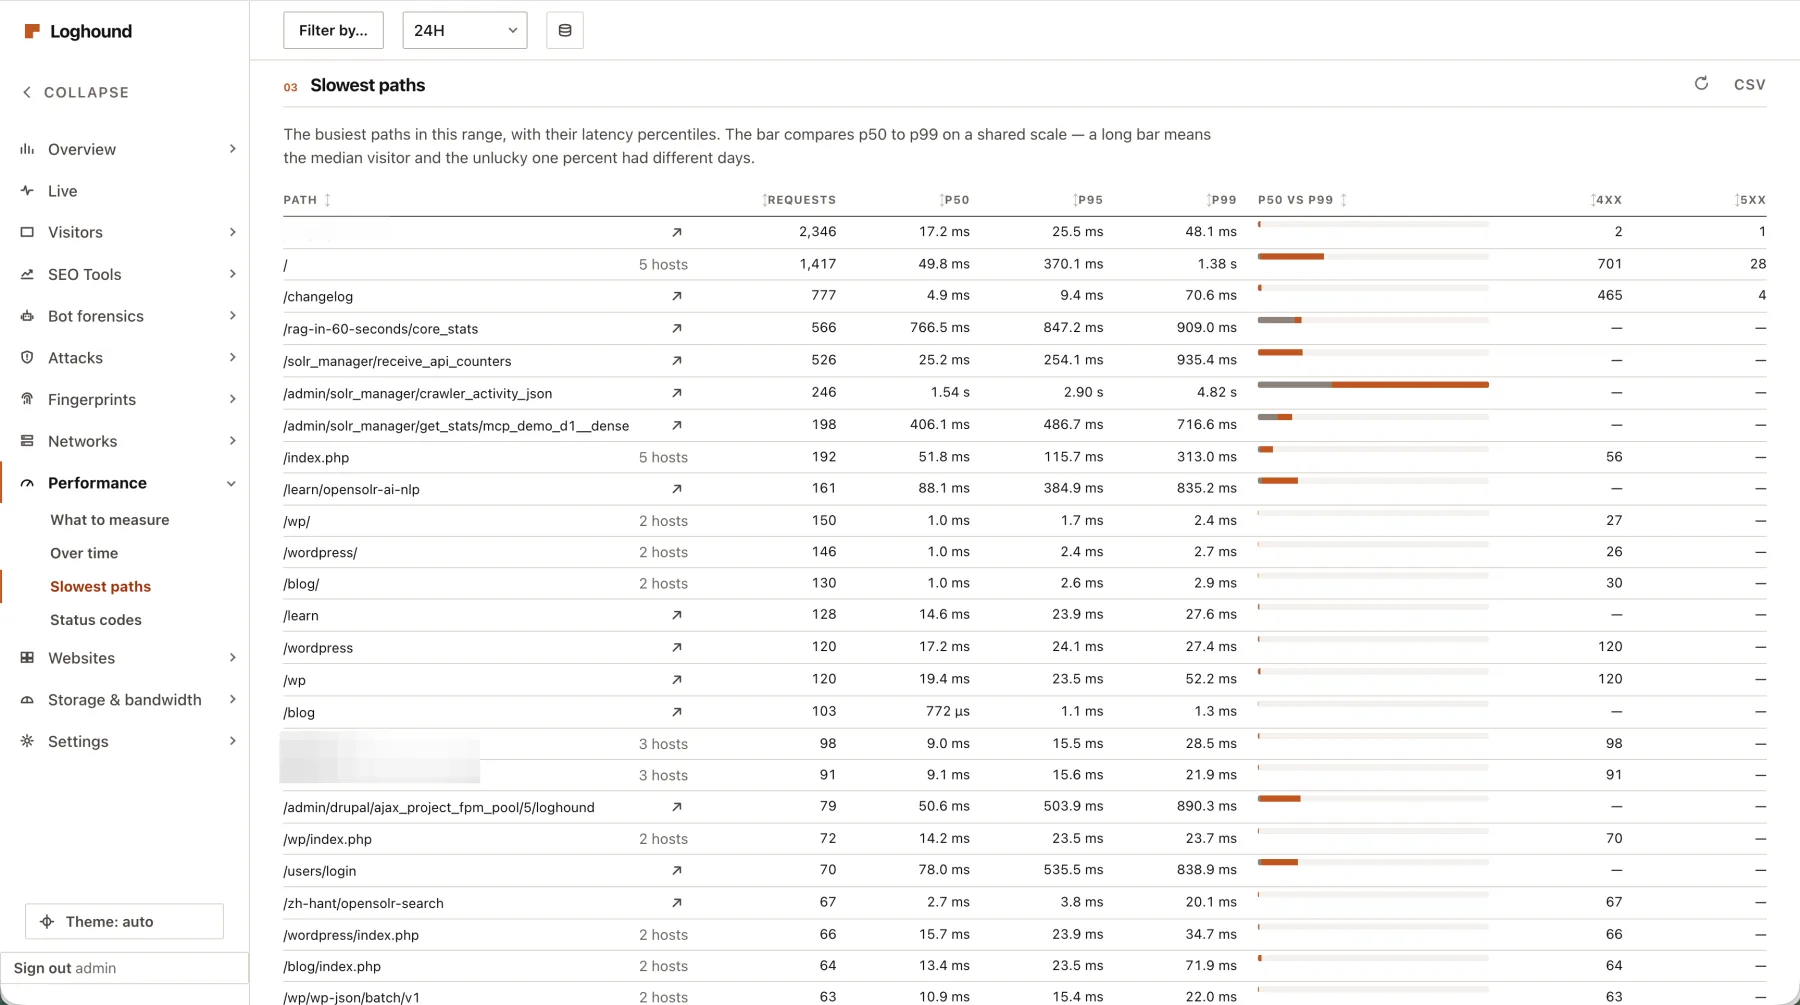
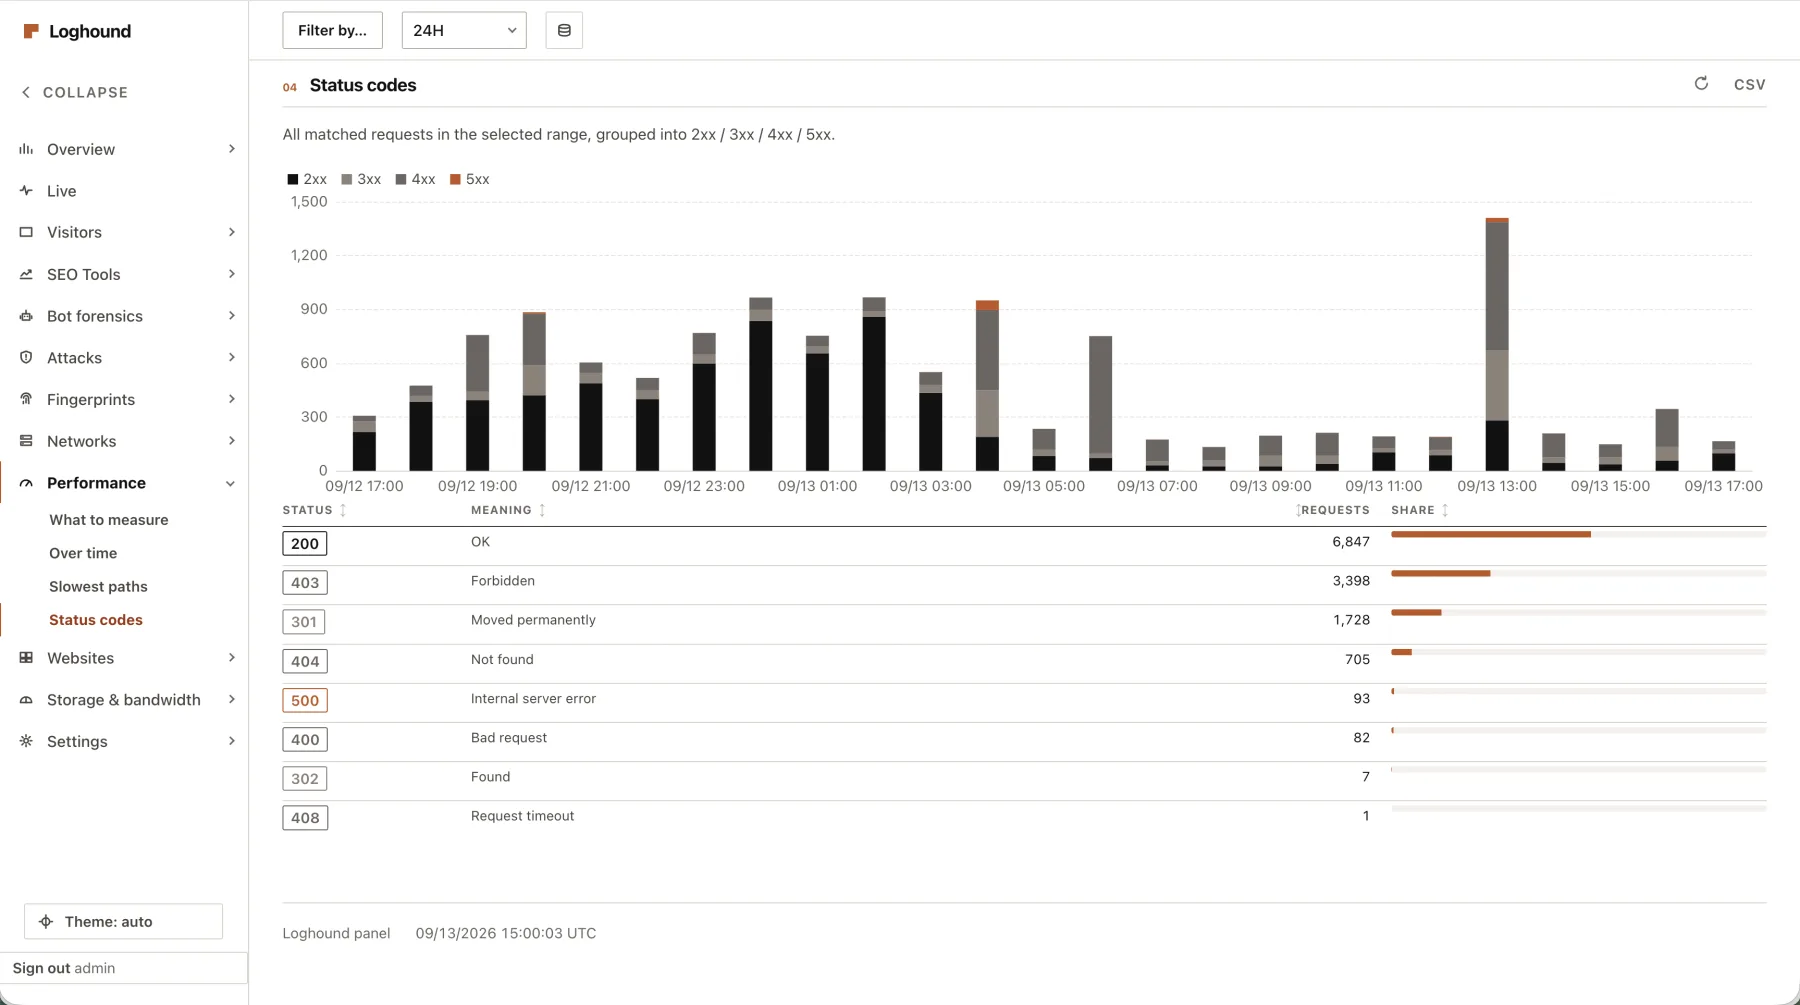
The traffic looks human from every angle you are currently looking from
Loghound was not written from a threat model. It was written because a capture of this site's own traffic did not survive being looked at properly.
Roughly half of the sessions a conventional analytics tool reported on opensolr.com carried a hard bot signature. Identical header fingerprints across unrelated consumer ISPs. One page each, never two. Every one of them reported at exactly ten seconds on site.
They were not caught by anything, and it is worth being precise about why. This traffic does everything right:
What it does that defeats the usual checks
Every one of these is why the ordinary defences report nothing.
- It fetches sub-resources. Images, CSS, JavaScript, the favicon. "No assets" never fires.
- It executes JavaScript. It reaches the site's own analytics endpoint with a full payload — screen resolution, language, timezone. That endpoint is only ever reached by code that ran in a JavaScript engine, so the site's analytics counted every one of them as a human visitor.
- The User-Agents are ordinary. Recent Chrome on Windows 10 and on Linux. Nothing in any blocklist.
- The addresses are spread across unrelated networks, which defeats every per-address rate limit.
- One of them even downloads a 10 MB file — engagement, by any conventional measure.
What it cannot hide
The whole value of a rotating proxy fleet is that it is one automation stack wearing many addresses.
- The header tuple is byte-identical across addresses on completely different ISPs. It has to be: the stack behind them is one program.
- Three of them began a session in the same second. Then two more did it again seven minutes later. Five independent humans do not do that.
- Every one fetched exactly one page and left. The session shape is identical across all of them.
- Nobody scrolled, clicked or moved a pointer. Ten seconds of "time on site" with no interaction of any kind in it.
Hash everything except the address
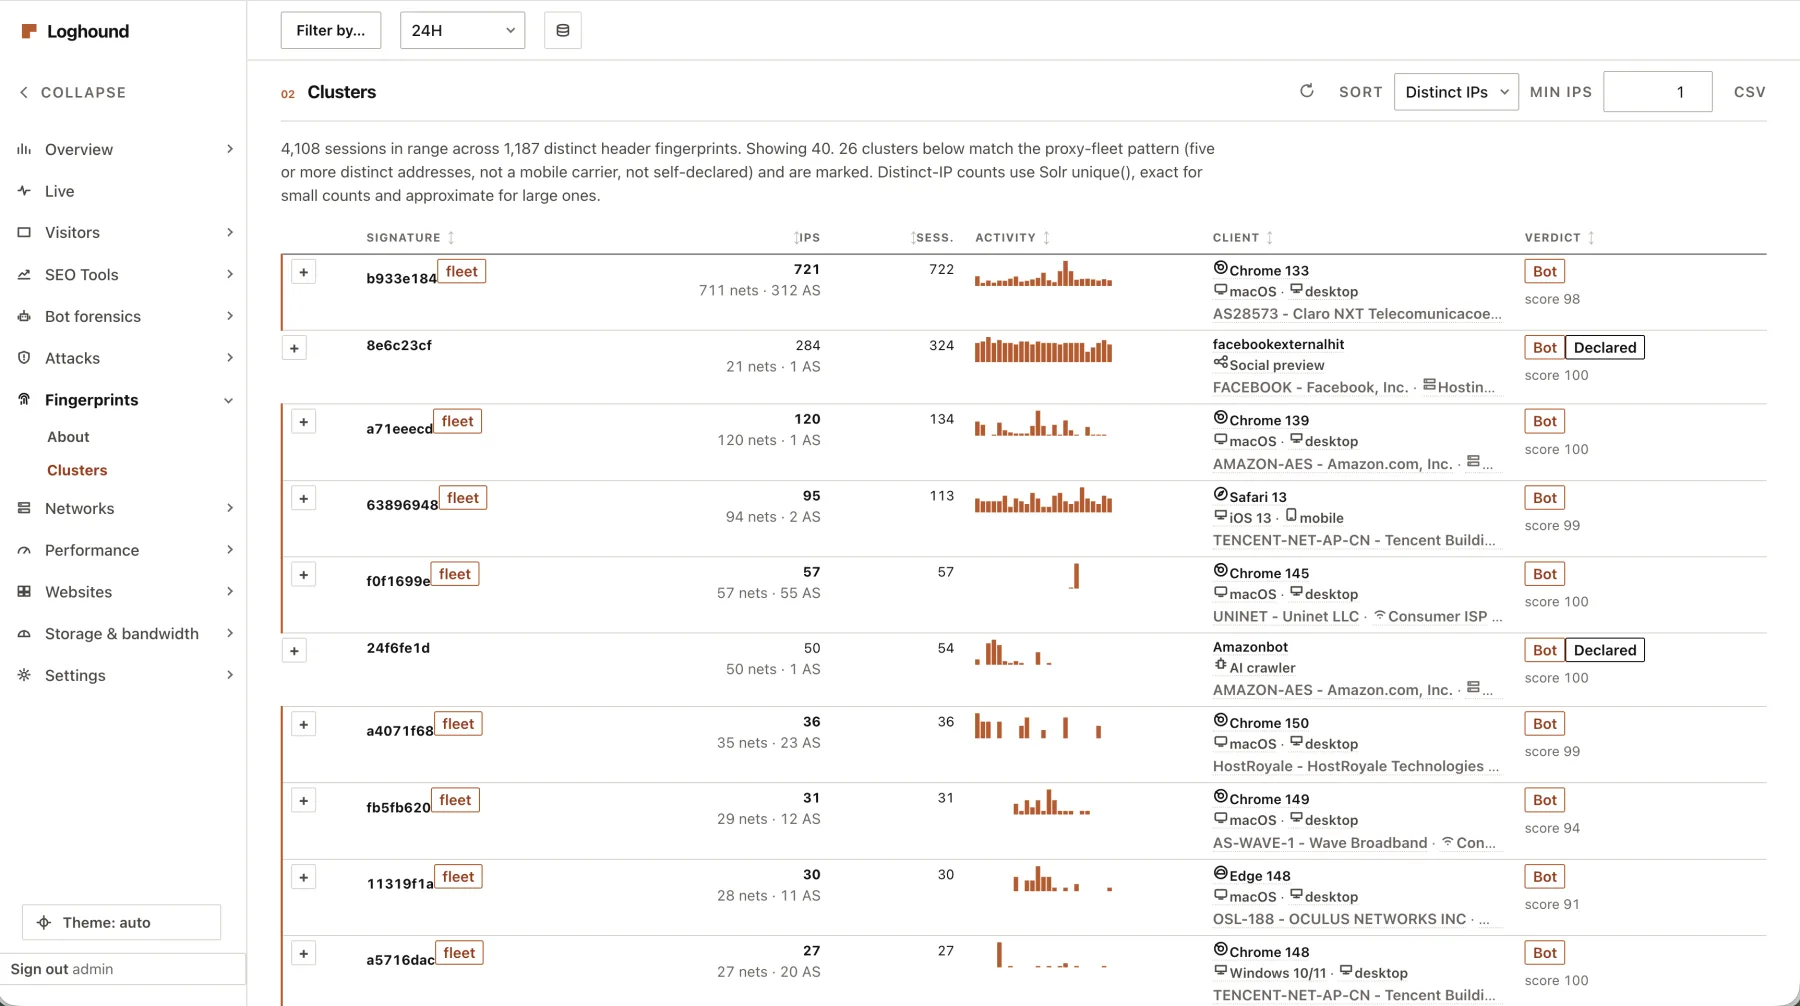
A fleet on rotating residential proxies changes its exit address on every request and changes nothing else. So any fingerprint that includes the address identifies nothing, and one that deliberately excludes it collapses the fleet back into a single row. The rotation stops being camouflage and becomes the signature.
The fingerprint-cluster view, in outline: one row per header fingerprint, with the count of distinct addresses that shared it, expanding to the member addresses and their networks. Five or more on non-mobile networks within a day is worth 80 of the 100 points needed for a bot verdict — enough on its own. This is a diagram of the view, not a screenshot.
Three independent planes, cross-checked
Each plane alone is defeatable, and essentially every existing tool uses exactly one of them. All the power is in correlating the three — because the things that make a scraper survive the JavaScript plane are the things that give it away on the behavioural one.
Log-only analysers see plane 1. JavaScript-only analytics sees plane 3, and trusts it: a client that runs the script is a human, as far as it is concerned. That single assumption is why headless Chrome on residential proxies is counted as human traffic almost everywhere.
It reads the logs you already have
Apache, nginx and Caddy, including JSON formats. The setup wizard reads your web server configuration for the log format and file list, then shows you the mapping with five of your own log lines rendered as parsed records and a confidence percentage. Nothing is ever ingested with a silently guessed format.
It stores into two Opensolr indexes
One document per log line, one per session — in two indexes Loghound provisions on your Opensolr account during setup. It creates them, pushes both configsets, verifies that each one answers a query, and you never have to learn what a configset is. The fingerprint-cluster analysis is a JSON Facet query, which is why it stays fast on a busy site instead of turning into a table scan.
One installation covers every site on the box
It reads a whole log directory, not one file, and every hit and every session records the virtual host the request arrived on. The panel filters on it, so the entire dashboard becomes per-site rather than six sites added together, and the Websites view ranks them side by side on the share of their traffic that is evasive.
The panel is never served without a password
Two sign-in modes: HTTP basic, which curl and a monitoring check can use with nothing more than --user, or Loghound's own sign-in page with a session cookie and a real sign-out button. Failed attempts are counted per source address and only per source address, so somebody guessing can lock out the address they are guessing from and never lock you out of your own dashboard.
An optional JavaScript beacon
One line on your site. It reports whether JavaScript ran at all, whether the engine actually matches the version the User-Agent claims — a spoofed User-Agent cannot retrofit a JavaScript engine — and whether a human plausibly drove the pointer. No cookies, nothing stored on the visitor's device.
Every verdict carries its reasons
A score with no explanation is not evidence, so a verdict without reasons is treated as a bug rather than a rounding error. Twenty-six weighted rules, each with a code, and the ruleset version is written onto every session so a historical verdict stays traceable to the rules that produced it.
Honest crawlers are kept separate
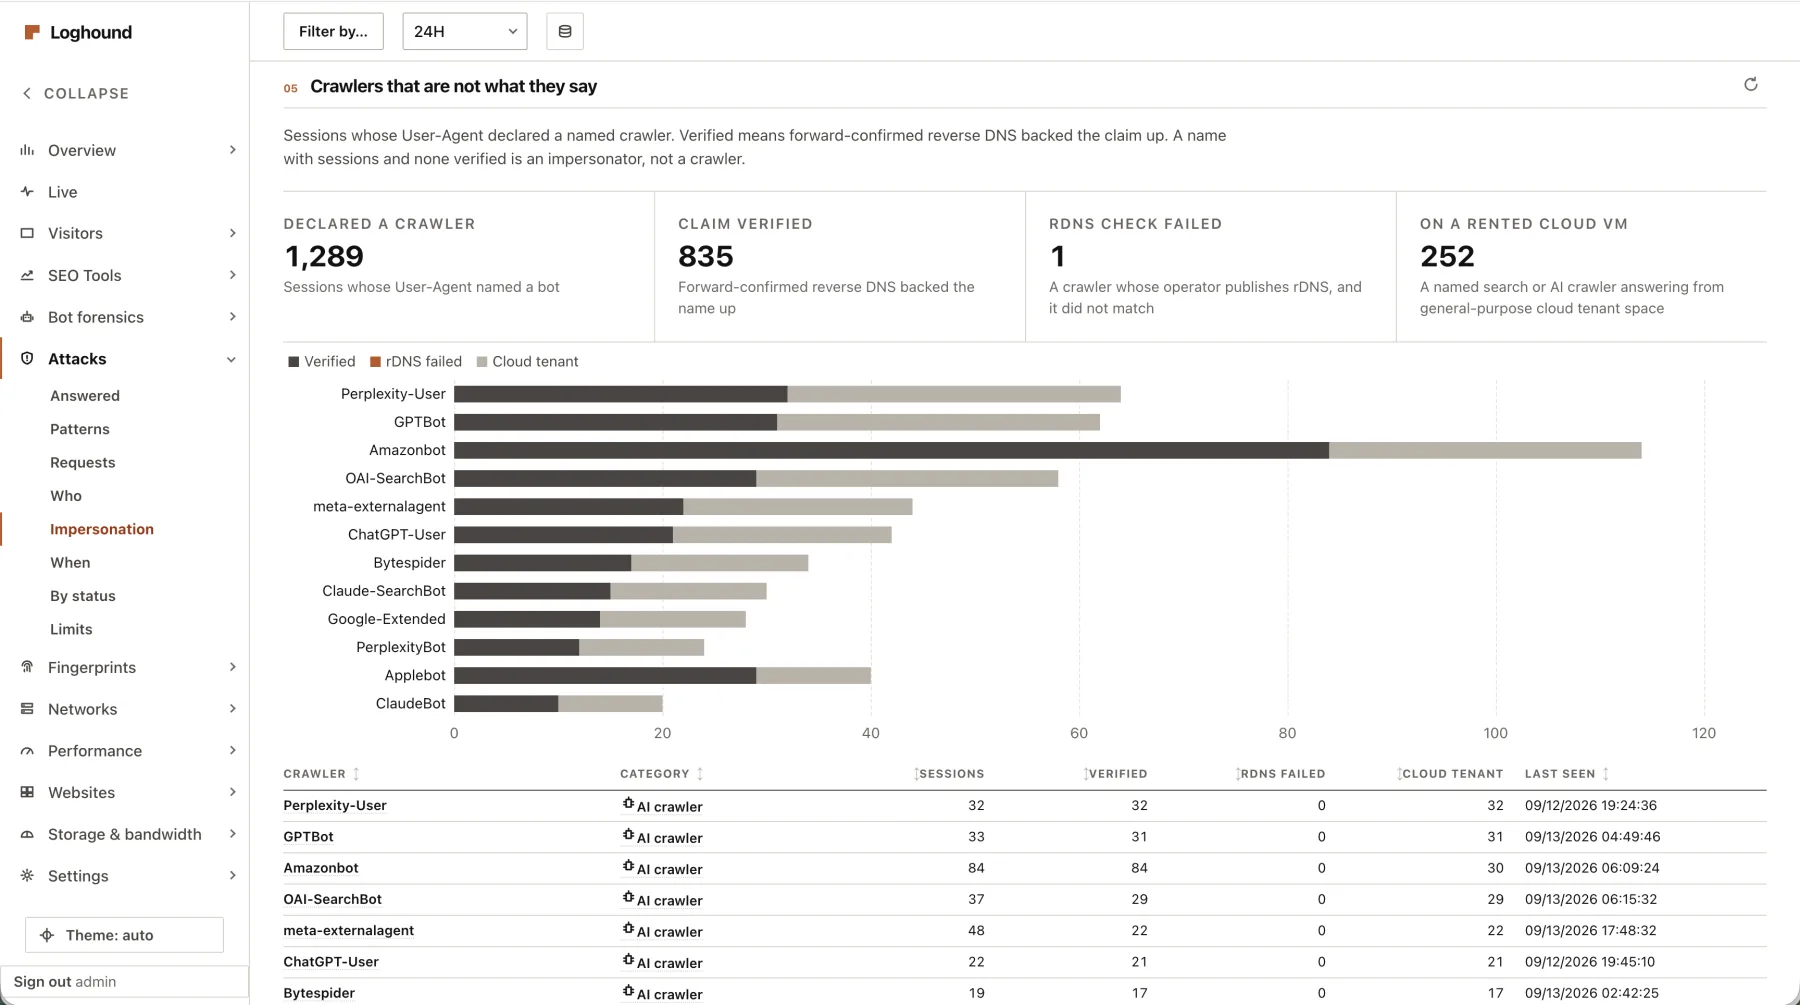
Googlebot and GPTBot are bots, and counting them as human traffic is how dashboards start lying to you — but they are presented apart from evasive traffic, always. Conflating "Googlebot indexed 400 pages" with "someone is scraping you from 200 residential addresses" is exactly what makes the usual tools useless here.
Your log files are never touched
Opened read-only, and never written to, truncated, rotated, renamed or deleted. The tailer survives logrotate, copytruncate, deletion while the file is held open, and inode recycling — the case where a rotation hands the new file the number the old one just freed and a naive tailer quietly stops ingesting while looking perfectly healthy.
Four numbers, kept apart
A visitor opens your article in a background tab at nine, gets distracted, comes back twenty minutes later, reads for four minutes with regular scrolling, then switches window and leaves the tab open until ten. Here is what each tool would tell you about that visit.
Bars to scale. The industry number is fifteen times the true one on this visit, and that is not an edge case — it is what a browser with tabs does all day.
How the clocks work
Three of them come from the beacon; the fourth comes from the log alone.
- Wall runs while the page exists. Nothing else.
- Visible runs only while the tab is on screen and the window has focus.
- Engaged runs only while visible and within thirty seconds of a real scroll, click, keypress or pointer movement.
- Log span is last request minus first request — the only number a log-only tool has, and it is structurally blind to the last page of every visit.
Why the numbers are trustworthy
Small decisions, but they are the difference between a measurement and a guess.
- It sees the last page of a session. The beacon flushes on pagehide, so the final pageview is measured — something a log-based tool structurally cannot do, because there is no later request to measure against.
- Monotonic clocks only. A clock correction or a daylight-saving change can never be added to somebody's reading time.
- A page that starts hidden accrues nothing. Prerendered and background-tab pages start at zero and stay there until they are actually shown.
- Missing stays missing. When no beacon arrived, the timing fields are absent rather than zero — a zero would enter every average as a real "0 seconds engaged" observation and quietly destroy the metric.
Seven languages, SEO Tools, attack patterns, and a chart on every ranked table
What landed in the releases since this page was first written. Each item below is live on the reference installation, and most of them are in the screenshots above.
Seven languages, and room for yours
The panel, the installer and the sign-in page now speak English, Română, Français, Deutsch, Español, 中文 and 日本語 — every screen, every chart, every setting and every message the server sends back. Pick one under Settings, or from the language bar on the first setup screen. Each translation is a plain file, so you can reword any sentence on your own installation or add a language Loghound does not ship, without touching the code, and your wording survives every upgrade. How it works.
SEO Tools: this period against another
A section of its own, and every number on it is shown for two periods side by side — today so far against yesterday until the same time, the last 7, 28 or 90 days, this month or last, or any two calendar ranges back to the first day your index holds. Nine pages: a scorecard, channels, search engines and AI assistants, landing pages, referring sites, countries and devices, engagement by channel, crawlers, and the pages crawlers fetch against the visits they actually receive. Every table ranks by biggest gains, biggest losses, new and gone, with a chart and a CSV export.
Attack patterns you define, per host
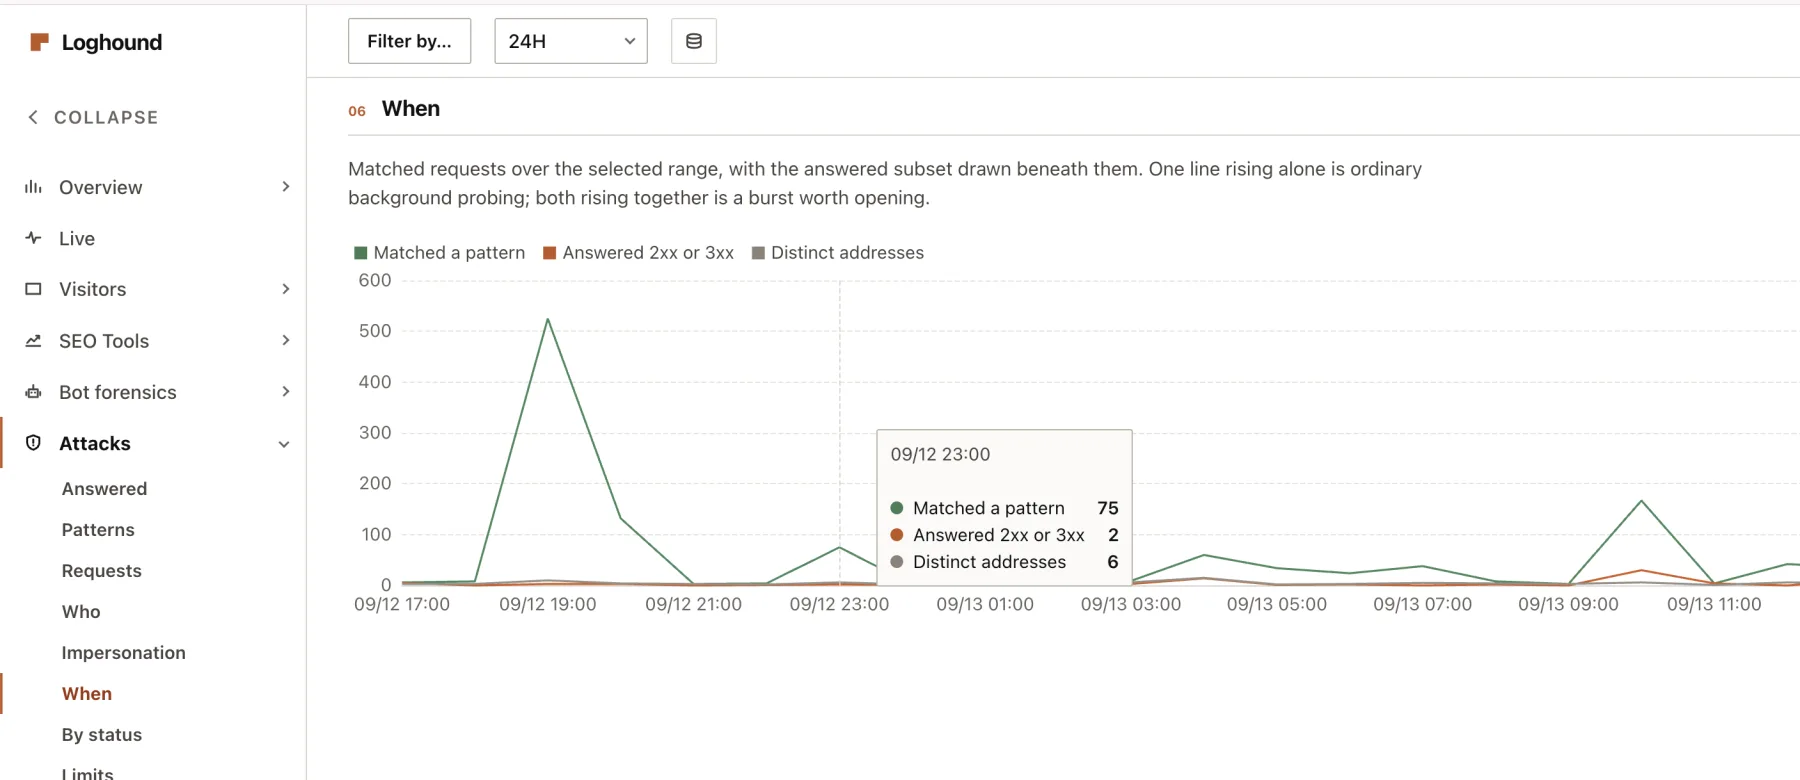
A settings page for requests that are an attack on your sites, on top of the built-in detector: text or a regular expression, for every host or for one. A match is flagged on the Attacks page with the pattern that fired, and the visit is scored a bot. It ships with 48 defaults that are an attack on any website — webshell names, deployment secrets, botnet droppers — and a default you switch off stays off after an update.
Software that does not say what it is
A visit whose User-Agent is neither a browser a person could be using nor a declared crawler — an empty header, a bare Mozilla/5.0, WordPress/6.4.3 — is scored a bot and classed as an undeclared client. The browser recognition behind it covers every engine and every desktop, mobile, regional, in-app, privacy and text-mode browser, TVs, consoles and feature phones, and it was checked against every User-Agent the reference installation had recorded.
A refused attack convicts
When your own defences answer a request that matched an attack pattern with a 403 or a 406, the visit is scored a bot: two independent judgements agreeing about one request is not a guess. Any other 403 adds points without convicting on its own, and a visit that has half of its page requests refused is flagged as trying paths until one works.
Every rule list travels as CSV
Ingest exclusions, live-stream exclusions and attack patterns each export to CSV and import the same file back, so a second installation starts with the rules the first one earned. An import adds to what is already there, skips duplicates and holds every row to the same checks as a rule typed by hand.
A chart above every ranked table
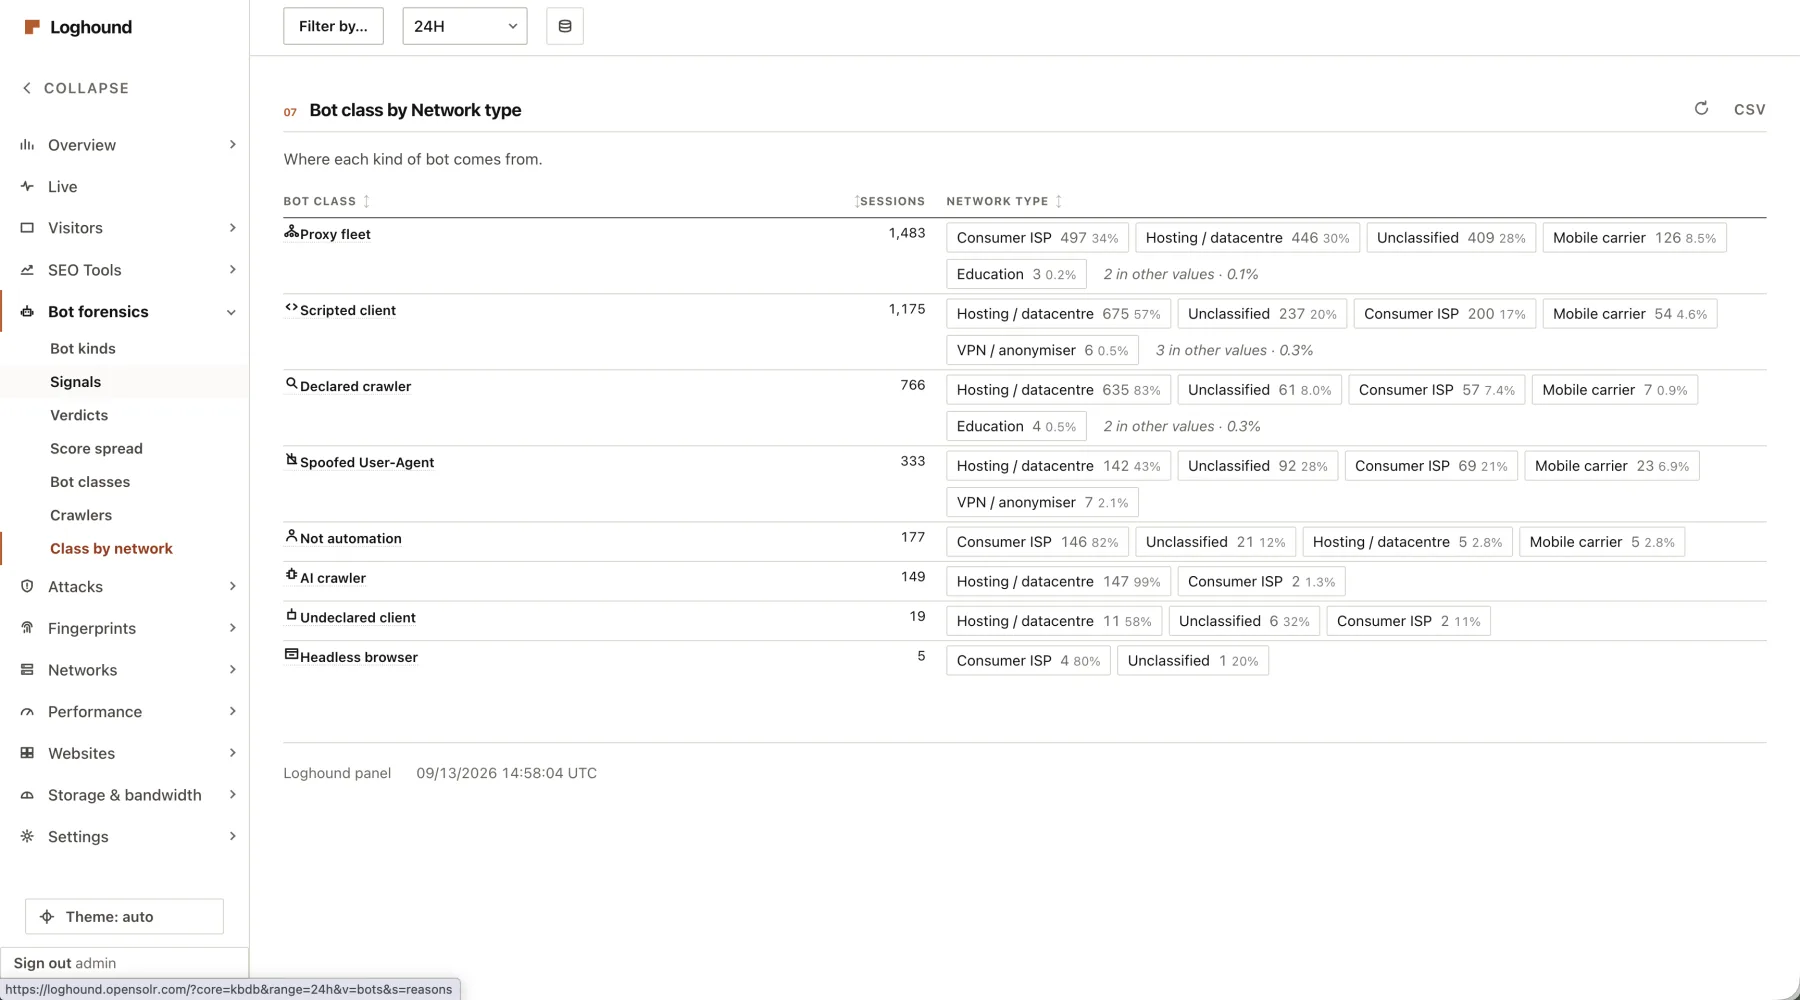
Bot classes and crawlers, attacking addresses, impersonation, netblocks and countries, top, entry, exit and trending pages, search terms, channels, referrers, landing-page bounce and signed-in visitors. Each chart is drawn from the rows its table holds, so the two always agree, and on a phone it keeps the top eight rows at a compact height.
A bot detector that oversells itself is worse than none
Because you would stop looking. So here is the honest list, and it is the same list that opens the project's own README.
A well-funded, careful scraper
Give every session a genuinely unique and mutually consistent header fingerprint, run a real non-headless browser, synthesise human-like pointer movement and pacing, never reuse an exit address — and Loghound will classify it as human. Everything here raises the cost of scraping. None of it makes scraping impossible, and anyone claiming otherwise is selling something.
Privacy-conscious humans get flagged
The single biggest source of false positives, and it deserves to be first. A visitor running a script blocker, strict tracking protection or a locked-down browser mode may never load the beacon, and from the log alone that is indistinguishable from a non-JavaScript client. The rule for it is deliberately weighted below the threshold so it can never condemn anyone on its own.
Traffic that never reaches your origin
A request served from a CDN edge or a cache in front of you produces no origin log line and does not exist as far as Loghound is concerned. If you run a CDN, you are analysing your cache misses — and Loghound will not silently pretend otherwise.
Low-and-slow scrapers
One page, one address, one fingerprint, once a day, from a residential network. It sits below every threshold in the ruleset by construction. The cluster signal — the strongest thing here — needs a fleet to detect a fleet.
API and native-app traffic
There is no beacon in a native application, so the execution plane is permanently blind there and every client looks like a non-JavaScript one. Point Loghound at that vhost's log and read the transport plane instead.
Carrier-grade NAT
Thousands of real mobile users share a small pool of addresses, which is why the fleet rule explicitly excludes mobile networks — and why an ASN misclassification turns into a batch of false positives rather than one.
It is not a firewall and it blocks nothing
Loghound observes and reports. It issues no challenges, rate-limits nothing and writes no firewall rules. Deciding what to do about what it finds is your job, and that is precisely why every verdict ships with its reasons attached.
It does not do product analytics
No funnels, no goals, no A/B tests, no revenue attribution, no cohort retention. If you need those, a product analytics tool is the right answer — and Loghound runs alongside it.
Clone it, and look before you leap
PHP 8.1 or newer with five standard extensions, systemd, read access to your access logs, and an Opensolr account for the storage. That is the whole dependency list — no Composer packages, no vendor/, no npm and no build step, on purpose, so git clone plus one script works on a bare box. It is also on Packagist, if composer create-project is the way you prefer to fetch things; it downloads the same tree and installs nothing else.
It will not break your box
It never modifies an existing vhost, PHP-FPM pool, cron entry or service, never overwrites a file it did not write, validates every configuration it generates before enabling it, rolls back if validation fails, and reloads rather than restarts so other sites are undisturbed. It also refuses to deploy a TLS certificate that does not chain to a trusted root.
It works on plain combined
Zero configuration on a default Apache or nginx. Logging a handful of extra headers makes the fingerprint substantially sharper — the documentation gives you the block to paste and a table saying exactly which detection signals each individual header buys, so you can take some of it and not the rest.
Retention is sized to your plan
Setup asks for your Opensolr email address and API key, provisions both indexes, pushes the configsets and verifies them. After that, Loghound deletes the oldest data before it writes the new data, so the window simply rolls and the account's disk quota is never reached. It runs on any plan, the free one included, and buying more disk buys more history — that is the whole of the relationship.
Open source
Loghound is free, MIT licensed and maintained in the open. Browse the code, open an issue, or sponsor the work that keeps it current.
Find out what your traffic actually is
Loghound is free, MIT licensed and runs on your own server, reading your logs read-only. It keeps what it learns in two Opensolr indexes it provisions during setup, so it needs an Opensolr account — the free tier is enough to start, and retention grows with the plan. The code is one git clone or one composer create-project away.