The Complete Opensolr Platform Guide
Managed Solr Hosting
Opensolr is a fully managed Apache Solr hosting platform. You get production-grade Solr clusters without managing servers, JVMs, or replication — we handle all of that.
Getting Started — Create Your First Index
1. Create your account
Head to opensolr.com and click Sign Up. Enter your email, choose a password, and confirm via the activation email. Once logged in, you land on your Dashboard — the central hub for indexes, clusters, billing, team members, and API keys.

2. Open the Control Panel and click "Add New"
Click your username in the top-right corner, select Control Panel, then open My Indexes and click Add New.


3. Choose your region and Solr version
Use the filter dropdowns to select a Region, Solr Version, and optionally a Country. Click the cluster card that matches your needs.


4. Name your index and create it
Give your index a meaningful name (e.g. my_website, product_search) or keep the auto-generated ID. Click Add Index — your index is provisioned in seconds with connection details, hostname, port, and credentials ready to use.

5. Upload your configuration
Click your index name to enter its Index Control Panel, then go to Configuration. Edit config files live in the browser (schema.xml, solrconfig.xml, synonyms, stopwords) or upload a ready-made config zip for your CMS. Your index is now ready to receive data.
See Solr Configuration Files Dependency Flow for details on how config files work together.

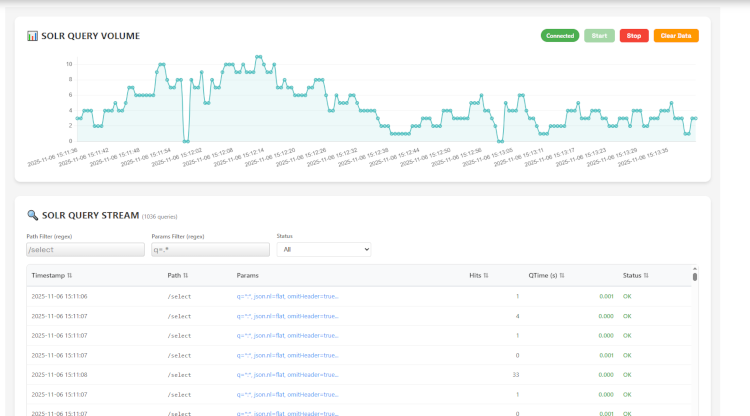
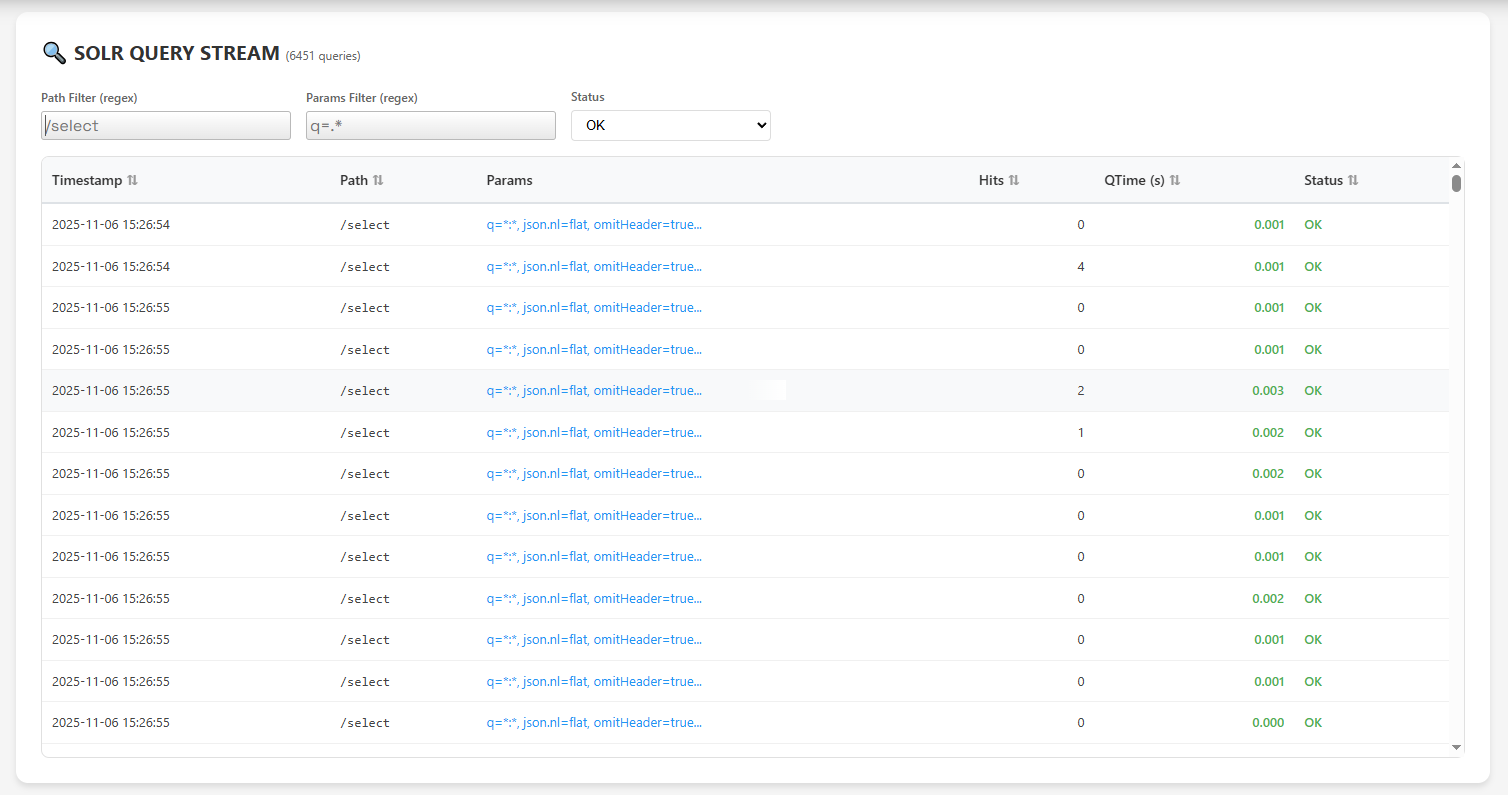
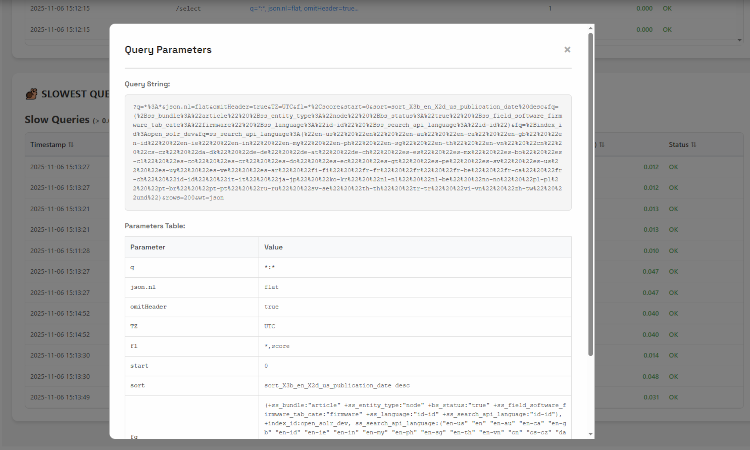
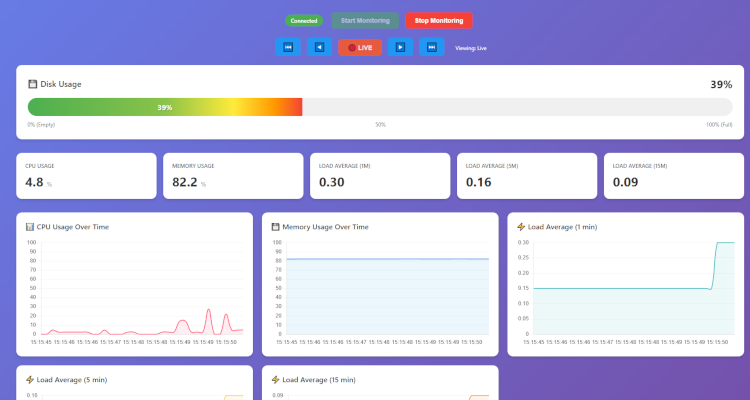
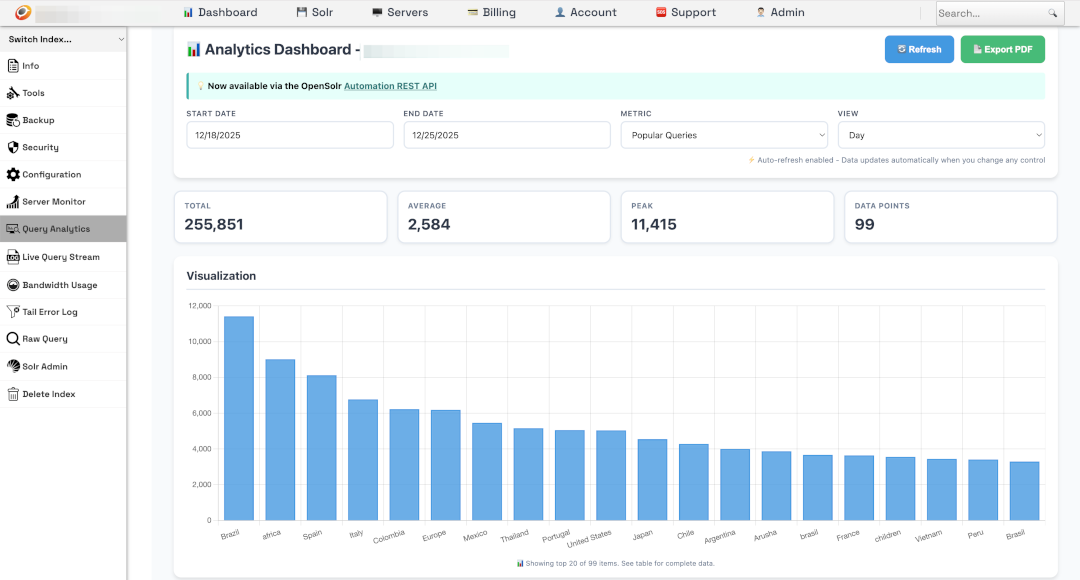
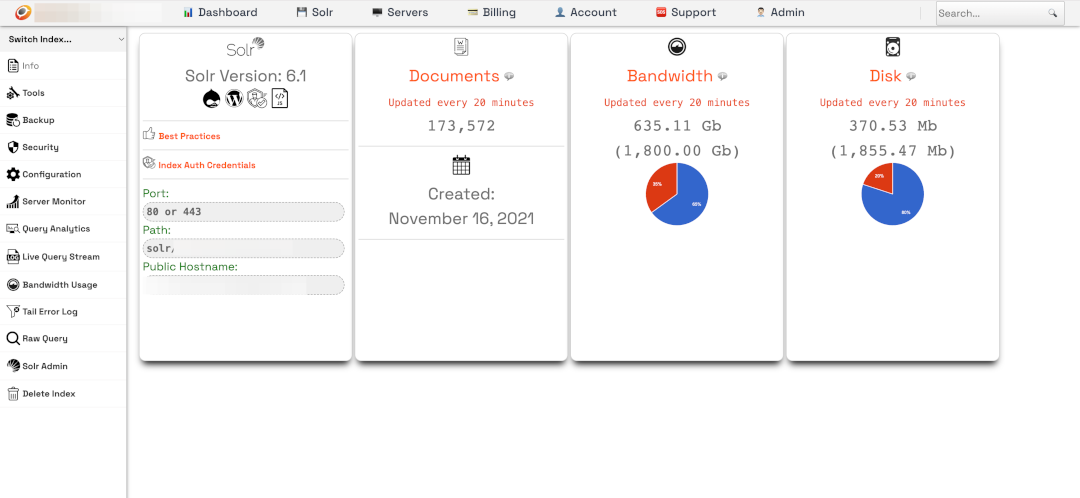
The Opensolr Control Panel
A single web-based dashboard for managing every aspect of your Solr indexes — from live analytics and query monitoring to configuration, security, backups, and index tools.
Connect Your Application
/solr/INDEX_NAME, and your auth credentials. Save and reindex./update, query via /select. Supports JSON, XML, and CSV.Opensolr Web Crawler
Don't have an app backend or CMS? The Opensolr Web Crawler crawls any website and builds a fully indexed, searchable site — no code, no plugins, no infrastructure to manage.
App Server Management
Beyond Solr hosting, Opensolr manages your entire application stack — Drupal, Laravel, WordPress, or any framework running on your own servers or ours.
Drupal Modules — Opensolr Search & Turbo Indexer
Opensolr actively contributes to the Drupal ecosystem with two dedicated modules. The Opensolr Search Module is a standalone Drupal 10/11 module with hybrid vector + keyword search, faceted navigation, AI-powered answer hints, autocomplete, analytics dashboard, query elevation, and real-time content sync — with zero Search API dependency. The Opensolr Turbo Indexer is a Drush-based parallel indexing engine that dramatically speeds up Solr indexing for large Drupal sites.
drush ost --workers=3 --batch=100 for turbo parallel indexing, drush oss for stats, drush osstop to halt.drush ost --background. Schedule via cron for fully automated, hands-free reindexing.We also maintain the Search API Opensolr connector module, which simplifies connecting Drupal's Search API to any Opensolr-hosted index. For a standalone experience without Search API, use the Opensolr Search Module instead.
AI-Powered Search
Opensolr offers built-in AI search capabilities that go beyond traditional keyword matching.
REST API — Automate Everything
Every operation in the Opensolr Control Panel is available through the REST API. Automate index provisioning, config management, security, backups, crawling, and monitoring programmatically.
Quick API Examples
Once your index is live, interact with it directly via HTTP. Replace USER:PASS with your index credentials and CLUSTER.opensolr.com with your cluster hostname.
Search:
curl -u USER:PASS "https://CLUSTER.opensolr.com/solr/INDEX_NAME/select?q=laptop&rows=10&wt=json"
Index a document:
curl -u USER:PASS "https://CLUSTER.opensolr.com/solr/INDEX_NAME/update?commit=true" \
  -H "Content-Type: application/json" \
  -d '[{"id":"1","title":"My First Document","content":"Hello Solr!"}]'
PHP:
$url = 'https://CLUSTER.opensolr.com/solr/INDEX_NAME/select?q=laptop&wt=json';
$context = stream_context_create(['http' => [
    'header' => 'Authorization: Basic ' . base64_encode('USER:PASS')
]]);
$response = file_get_contents($url, false, $context);
$data = json_decode($response, true);
print_r($data['response']['docs']);
JavaScript:
const response = await fetch(
  'https://CLUSTER.opensolr.com/solr/INDEX_NAME/select?q=laptop&wt=json',
  { headers: { 'Authorization': 'Basic ' + btoa('USER:PASS') } }
);
const data = await response.json();
console.log(data.response.docs);
For a complete reference of all search parameters, see Querying the Solr API: Search Parameters Explained.
Troubleshooting
| Issue | Likely Cause | Fix |
|---|---|---|
| Can't connect to Solr | Wrong hostname, port, or credentials | Check your Index Control Panel for the correct URL. Use port 443 for HTTPS. |
| No search results | Content not indexed or schema mismatch | Reindex your content. Ensure schema fields match what your app sends. |
| Drupal: "Server could not be reached" | Config set not uploaded or wrong Solr version | Upload the config set from Search API Solr. Check Solr version matches. |
| WordPress plugin error | Plugin version incompatibility | Update the Opensolr Search plugin. Verify connection details. |
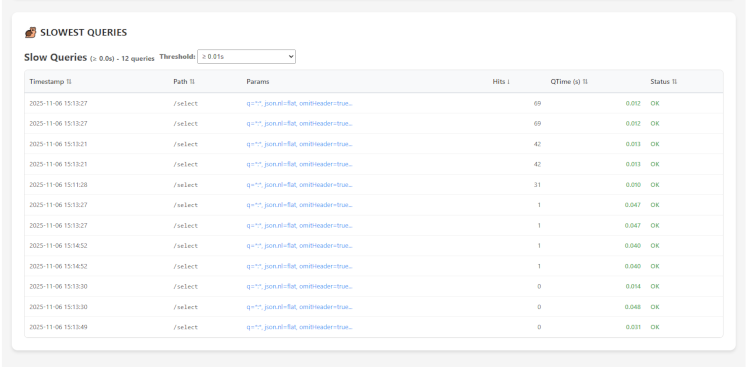
| Slow queries | Unoptimized index or expensive queries | Run Optimize from Tools, check Query Debugging. |