Real-Time Solr Monitoring & Analytics
Monitor Your Search Performance Like Never Before
Opensolr brings enterprise-grade monitoring directly into your dashboard. No setup, no configuration, no external tools - just powerful real-time insights into your Solr infrastructure the moment you need them.
Live Query Volume Tracking
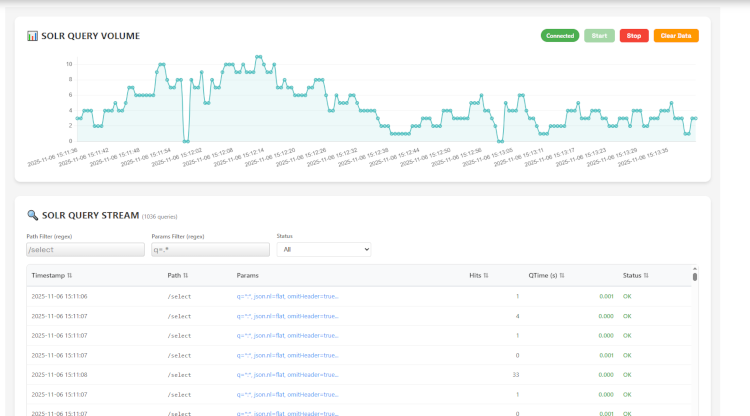
See your search traffic as it happens. Our real-time query volume chart updates every second, giving you instant visibility into traffic patterns, usage spikes, and query trends.
Perfect for:
- Identifying traffic patterns and peak usage times
- Capacity planning and scaling decisions
- Detecting unusual activity or traffic spikes
- Understanding user behavior in real-time
🔍 Complete Query Stream Analysis
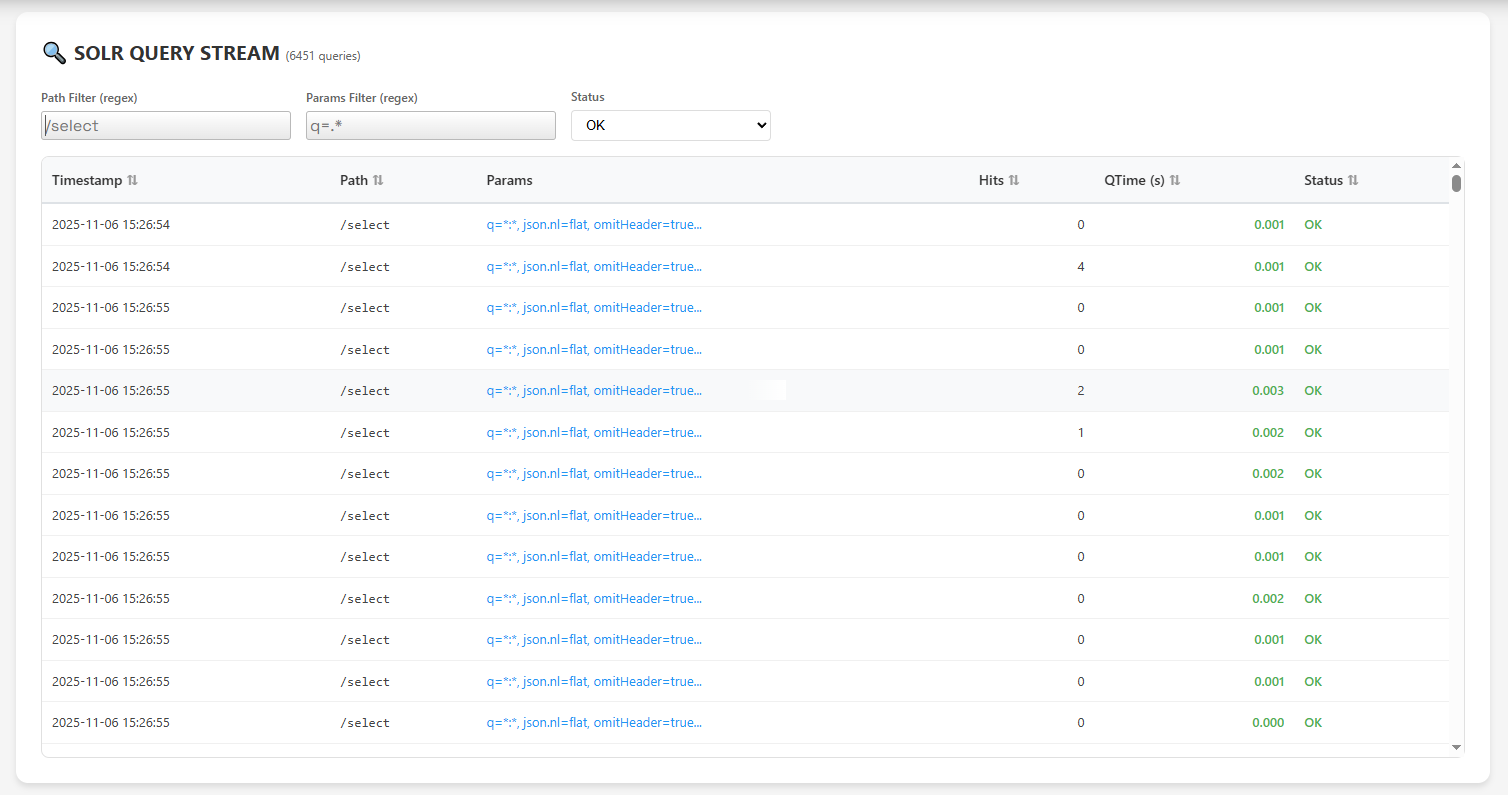
Every query that hits your Solr index is captured and displayed in real-time. See exactly what your users are searching for, how long queries take, and which searches are performing well.
What You Get:
- Timestamp Precision - Track when every query executed
- Full Query Details - See paths, parameters, and search terms
- Performance Metrics - Response times displayed to the millisecond
- Result Counts - Understand how many hits each query returns
- Status Monitoring - Catch errors and issues instantly
Smart Filtering lets you search through thousands of queries using regex patterns on paths and parameters. Find exactly what you're looking for in seconds.
🔬 Deep Query Inspection
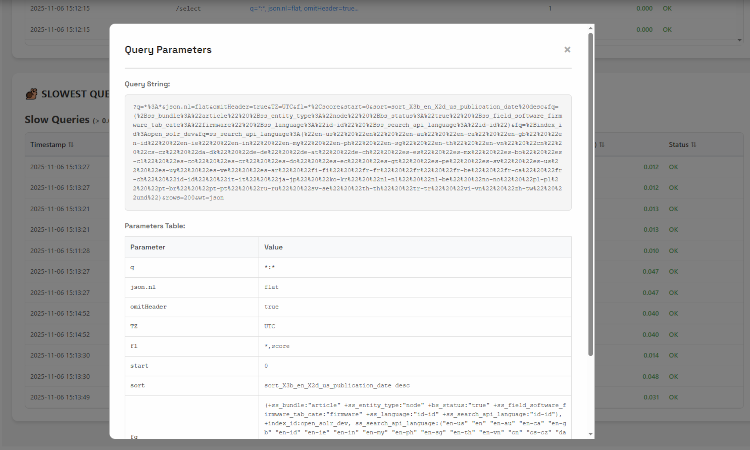
Click any query to see the complete breakdown. Every parameter, every filter, every detail - presented clearly and ready to analyze or test.
See Everything:
- Complete query string ready to copy and test
- All parameters displayed in an easy-to-read table
- Multi-value parameters (like filter queries) shown properly
- Clean formatting - no URL encoding clutter
Perfect for debugging, optimization, and understanding exactly what your application is sending to Solr.
⚡ Smart Slow Query Detection
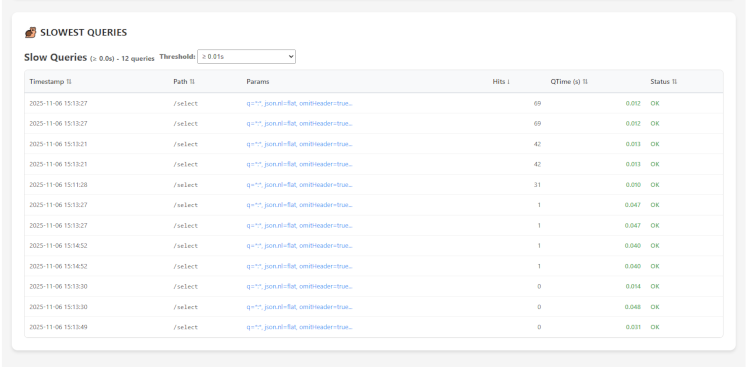
Slow queries hurt user experience and waste resources. Our intelligent slow query monitor automatically identifies and tracks queries that need attention.
Customizable Thresholds: Set your own definition of "slow" - from 0.2 seconds to 1.0 seconds - and let Opensolr automatically flag queries that exceed your threshold.
Why It Matters:
- Identify optimization opportunities
- Find queries that need better indexing
- Track performance improvements over time
- Proactively address issues before users complain
Queries are sorted by response time, putting your slowest queries front and center where they belong.
🖥️ Real-Time Server Health Monitoring
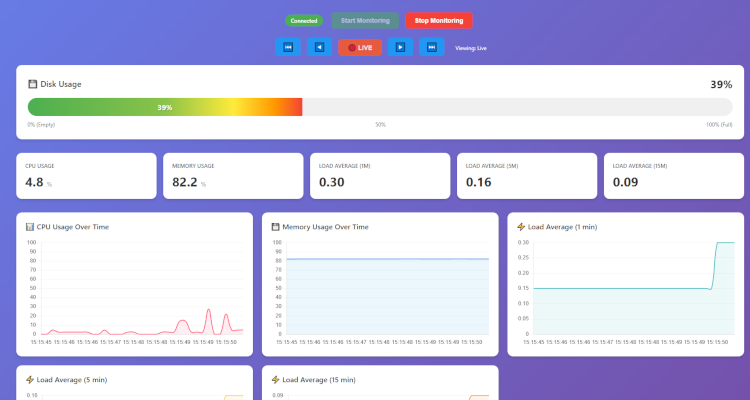
Your Solr server's vital signs, updated live. Monitor CPU, memory, disk usage, and load averages - all in one beautiful dashboard.
System Metrics Include:
- CPU Usage - Real-time processor utilization with trend graphs
- Memory Consumption - RAM usage tracking over time
- System Load - 1, 5, and 15-minute load averages
- Disk Capacity - Visual indicators show available space at a glance
Everything updates automatically - no refreshing needed. Just watch your infrastructure perform.
🎯 Getting Started
Accessing your monitoring dashboard is simple:
- Log into your Opensolr Control Panel
- Select any of your Solr indexes
- Find the monitoring options in the left sidebar:
- "Solr Log" for real-time query monitoring
- "Server Monitor" for system health metrics
That's it. Your monitoring is already running, already collecting data, already ready to use.
✨ Why Opensolr Monitoring Stands Out
Built for the way you work:
- Zero Setup - Start monitoring the moment you create an index
- Real-Time Updates - See changes as they happen, not minutes later
- Millisecond Precision - Accurate performance metrics you can trust
- Intelligent Filtering - Find the queries that matter
- Always Included - No extra fees, no add-ons, no hidden costs
Professional tools at your fingertips: Every Opensolr account includes full monitoring capabilities. Whether you're running a small blog or a high-traffic e-commerce platform, you get the same powerful insights.
💡 Real-World Benefits
For Developers: Debug issues faster, optimize queries with confidence, and understand exactly how your search is performing in production.
For Operations: Monitor server health, plan capacity needs, and catch problems before they impact users.
For Business: Understand search usage patterns, improve user experience, and make data-driven decisions about your search infrastructure.
📊 Web Crawler & Site Search Analytics
If you're using the Opensolr Enterprise Site Search (Web Crawler), there's a separate layer of analytics specifically for crawl-based search — covering crawl stats, search query analytics, click-through rates, and more.
👉 Solr-Level vs Web Crawler Search Analytics — a detailed comparison of both analytics systems and when to use each.
🚀 The Opensolr Advantage
Professional search infrastructure shouldn't require enterprise budgets or DevOps teams. Opensolr delivers powerful, production-ready monitoring as part of every account.
This is what modern search infrastructure looks like.
Monitoring is included with all Opensolr plans. Log in now to start exploring your data.
Need help? Our team is here: support@opensolr.com | Documentation